Xerox 2012 Annual Report Download - page 38
Download and view the complete annual report
Please find page 38 of the 2012 Xerox annual report below. You can navigate through the pages in the report by either clicking on the pages listed below, or by using the keyword search tool below to find specific information within the annual report.-
 1
1 -
2
-
3
-
4
-
5
-
6
-
7
-
8
-
9
-
10
-
11
-
12
-
13
-
14
-
15
-
16
-
17
-
18
-
19
-
20
-
21
-
22
-
23
-
24
-
25
-
26
-
27
-
 28
28 -
 29
29 -
 30
30 -
 31
31 -
 32
32 -
 33
33 -
 34
34 -
 35
35 -
 36
36 -
 37
37 -
 38
38 -
 39
39 -
 40
40 -
 41
41 -
 42
42 -
 43
43 -
 44
44 -
 45
45 -
 46
46 -
 47
47 -
 48
48 -
49
-
50
-
51
-
52
-
53
-
54
-
55
-
56
-
57
-
58
-
59
-
60
-
61
-
62
-
63
-
64
-
65
-
66
-
67
-
68
-
69
-
70
-
71
-
72
-
73
-
74
-
75
-
76
-
77
-
78
-
79
-
80
-
81
-
82
-
83
-
84
-
85
-
86
-
87
-
88
-
89
-
90
-
91
-
92
-
93
-
94
-
95
-
96
-
97
-
98
-
99
-
100
-
101
-
102
-
103
-
104
-
105
-
106
-
107
-
108
-
109
-
110
-
111
-
112
-
113
-
114
-
115
-
116
-
117
-
118
-
119
-
120
 |
 |
Management’s Discussion
36
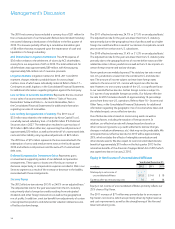
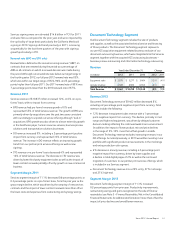
RD&E as a percent of revenue for the year ended December 31,
2012 of 2.9% decreased 0.3-percentage points. In addition to lower
spending, the decrease was also driven by the positive mix impact of
the continued growth in Services revenue, which historically has a lower
RD&E percent of revenue.
RD&E of $655 million for the year ended December 31, 2012, was
$66 million lower, reflecting the impact of restructuring and
productivity improvements. Innovation is one of our core strengths
and we continue to invest at levels that enhance this core strength,
particularly in color, software and services. During 2012 we managed
our investments in R&D to align with growth opportunities in areas like
business services, color printing and customized communication. Xerox
R&D is also strategically coordinated with Fuji Xerox.
RD&E as a percent of revenue for the year ended December 31,
2011 of 3.2% decreased 0.4-percentage points. In addition to lower
spending, the decrease was also driven by the positive mix impact of
the continued growth in Services revenue, which historically has a lower
RD&E percent of revenue.
RD&E of $721 million for the year ended December 31, 2011, was
$60 million lower, reflecting the impact of restructuring and
productivity improvements.
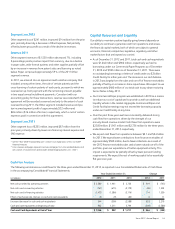
Selling, Administrative and General Expenses (“SAG”)
SAG as a percent of revenue of 19.2% decreased 0.7-percentage
points for the year ended December 31, 2012. The decrease was driven
by spending reductions reflecting benefits from restructuring and
productivity improvements in addition to the positive mix impact from
the continued growth in Services revenue, which historically has a lower
SAG percent of revenue.
SAG expenses of $4,288 million for the year ended December 31, 2012
were $209 million lower than the prior year period including a
$60 million favorable impact from currency. The decrease in SAG
expenses reflects the following:
• $240 million decrease in selling expenses reflecting the benefits
from restructuring and productivity improvements, as well as lower
compensation-related expenses and advertising spending partially
offset by the impact of acquisitions.
• $68 million increase in general and administrative expenses
as restructuring savings and productivity improvements were
more than offset by the impact of acquisitions and deferred
compensation expense.
• $37 million decrease in bad debt expenses to $120 million, driven
primarily by lower write-offs in Europe.
SAG as a percent of revenue of 19.9% decreased 1.3-percentage
points, or 1.0-percentage points on a pro-forma1 basis, for the year
ended December 31, 2011.
SAG expenses of $4,497 million for the year ended December 31,
2011 was $97 million lower than the prior year period, or $156 million
lower on a pro-forma1 basis, both including a $68 million unfavorable
impact from currency. The pro-forma SAG expense decrease reflects
the following:
• $68 million decrease in selling expenses reflecting the benefits from
restructuring, productivity improvements and decrease in brand
advertising partially offset by the impact of acquisitions.
• $54 million decrease in general and administrative expenses
primarily reflecting lower compensation as well as the benefits from
restructuring and operational improvements.
• $31 million decrease in bad debt expense, to $157 million as
improvements in write-off trends in North America were more than
offset by higher write-offs in southern Europe.
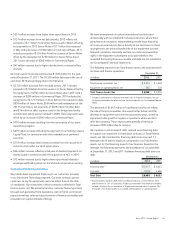
Restructuring and Asset Impairment Charges
During the year ended December 31, 2012, we recorded net
restructuring and asset impairment charges of $153 million
($97 million after-tax). Approximately 47% of the charges were related
to our Services segment and 53% to our Document Technology
segment and included the following:
• $160 million of severance costs related to headcount reductions of
approximately 6,300 employees primarily in North America. The
actions impacted several functional areas, and approximately 63%
of the costs were focused on gross margin improvements, 31% in
SAG and 6% on the optimization of RD&E investments.
• $5 million for lease termination costs primarily reflecting continued
optimization of our worldwide operating locations.
• $2 million of asset impairment losses.
The above charges were partially offset by $14 million of net reversals
for changes in estimated reserves from prior period initiatives.
We expect 2013 pre-tax savings of approximately $170 million from
our 2012 restructuring actions.
During the year ended December 31, 2011, we recorded net
restructuring and asset impairment charges of $33 million ($18 million
after-tax) which included the following:
• $98 million of severance costs related to headcount reductions of
approximately 3,900 employees primarily in North America. The
actions impacted several functional areas, and approximately 55%
of the costs were focused on gross margin improvements, 36% on
SAG and 9% on the optimization of RD&E investments.
• $1 million for lease termination costs.
• $5 million of asset impairment losses from the disposition of two
aircraft associated with the restructuring of our corporate aviation
operations.