Xerox 2012 Annual Report Download - page 76
Download and view the complete annual report
Please find page 76 of the 2012 Xerox annual report below. You can navigate through the pages in the report by either clicking on the pages listed below, or by using the keyword search tool below to find specific information within the annual report.-
 1
1 -
2
-
3
-
4
-
5
-
6
-
7
-
8
-
9
-
10
-
11
-
12
-
13
-
14
-
15
-
16
-
17
-
18
-
19
-
20
-
21
-
22
-
23
-
24
-
25
-
26
-
27
-
28
-
29
-
30
-
31
-
32
-
33
-
34
-
35
-
36
-
37
-
38
-
39
-
40
-
41
-
42
-
43
-
44
-
45
-
46
-
47
-
48
-
49
-
50
-
51
-
52
-
53
-
54
-
55
-
56
-
57
-
58
-
59
-
60
-
61
-
62
-
63
-
64
-
65
-
 66
66 -
 67
67 -
 68
68 -
 69
69 -
 70
70 -
 71
71 -
 72
72 -
 73
73 -
 74
74 -
 75
75 -
 76
76 -
 77
77 -
 78
78 -
 79
79 -
 80
80 -
 81
81 -
 82
82 -
 83
83 -
 84
84 -
 85
85 -
 86
86 -
87
-
88
-
89
-
90
-
91
-
92
-
93
-
94
-
95
-
96
-
97
-
98
-
99
-
100
-
101
-
102
-
103
-
104
-
105
-
106
-
107
-
108
-
109
-
110
-
111
-
112
-
113
-
114
-
115
-
116
-
117
-
118
-
119
-
120
 |
 |

Notes to Consolidated Financial Statements
(in millions, except per-share data and where otherwise noted)
74
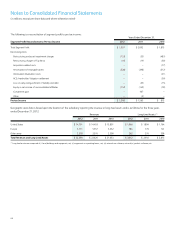
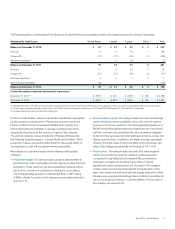
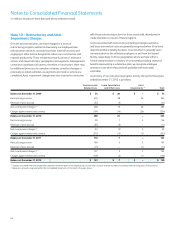
Credit quality indicators are updated at least annually, and the credit quality of any given customer can change during the life of the portfolio.
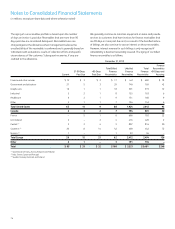
Details about our finance receivables portfolio based on industry and credit quality indicators are as follows:
December 31, 2012
Investment Non-investment Total Finance
Grade Grade Substandard Receivables
Finance and other services $ 252 $ 147 $ 59 $ 458
Government and education 750 15 4 769
Graphic arts 92 90 137 319
Industrial 115 31 17 163
Healthcare 109 37 14 160
Other 70 39 34 143
Total United States 1,388 359 265 2,012
Finance and other services 151 116 40 307
Government and education 117 10 2 129
Graphic arts 37 34 30 101
Industrial 66 40 29 135
Other 75 43 11 129
Total Canada 446 243 112 801
France 274 294 134 702
U.K./Ireland 215 155 50 420
Central (1) 315 445 56 816
Southern (2) 139 230 73 442
Nordics (3) 49 36 9 94
Total Europe 992 1,160 322 2,474
Other 148 39 7 194
Total $ 2,974 $ 1,801 $ 706 $ 5,481
(1) Switzerland, Germany, Austria, Belgium and Holland.
(2) Italy, Greece, Spain and Portugal.
(3) Sweden, Norway, Denmark and Finland.