Xerox 2012 Annual Report Download - page 100
Download and view the complete annual report
Please find page 100 of the 2012 Xerox annual report below. You can navigate through the pages in the report by either clicking on the pages listed below, or by using the keyword search tool below to find specific information within the annual report.-
 1
1 -
2
-
3
-
4
-
5
-
6
-
7
-
8
-
9
-
10
-
11
-
12
-
13
-
14
-
15
-
16
-
17
-
18
-
19
-
20
-
21
-
22
-
23
-
24
-
25
-
26
-
27
-
28
-
29
-
30
-
31
-
32
-
33
-
34
-
35
-
36
-
37
-
38
-
39
-
40
-
41
-
42
-
43
-
44
-
45
-
46
-
47
-
48
-
49
-
50
-
51
-
52
-
53
-
54
-
55
-
56
-
57
-
58
-
59
-
60
-
61
-
62
-
63
-
64
-
65
-
66
-
67
-
68
-
69
-
70
-
71
-
72
-
73
-
74
-
75
-
76
-
77
-
78
-
79
-
80
-
81
-
82
-
83
-
84
-
85
-
86
-
87
-
88
-
89
-
 90
90 -
 91
91 -
 92
92 -
 93
93 -
 94
94 -
 95
95 -
 96
96 -
 97
97 -
 98
98 -
 99
99 -
 100
100 -
 101
101 -
 102
102 -
 103
103 -
 104
104 -
 105
105 -
 106
106 -
 107
107 -
 108
108 -
 109
109 -
 110
110 -
111
-
112
-
113
-
114
-
115
-
116
-
117
-
118
-
119
-
120
 |
 |

Notes to Consolidated Financial Statements
(in millions, except per-share data and where otherwise noted)
98
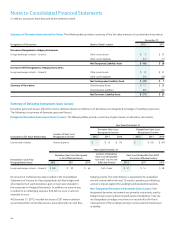
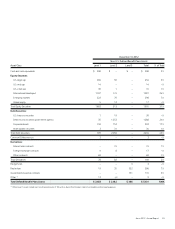
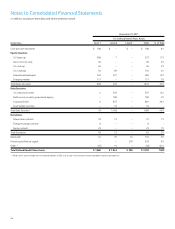
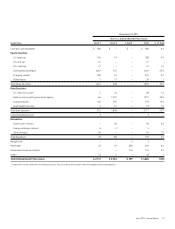
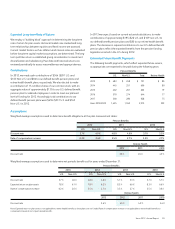
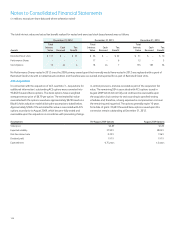
The following tables represent a roll-forward of the defined benefit plans
assets measured using significant unobservable inputs (Level 3 assets):
Fair Value Measurement Using
Significant Unobservable Inputs (Level 3)
U.S. Defined Private Equity/
Benefit Plans Assets Real Estate Venture Capital Total
Balance at December 31, 2010 $ 69 $ 307 $ 376
Purchases 2 30 32
Sales (6) (61) (67)
Realized gains (losses) – 46 46
Unrealized gains (losses) 6 (4) 2
Other 1 – 1
Balance at December 31, 2011 72 318 390
Purchases 1 20 21
Sales (11) (48) (59)
Realized gains (losses) 1 36 37
Unrealized gains (losses) (5) (26) (31)
Balance at December 31, 2012 $ 58 $ 300 $ 358
Fair Value Measurement Using
Significant Unobservable Inputs (Level 3)
Guaranteed
Non-U.S. Defined Insurance
Benefit Plans Assets Real Estate Contracts Hedge Funds Total
Balance at December 31, 2010 $ 206 $ 97 $ 3 $ 306
Purchases 67 3 – 70
Sales – (3) (1) (4)
Net transfers in from Level 1 2 12 – 14
Net transfers in from Level 2 – 9 – 9
Realized gains (losses) – (1) – (1)
Unrealized gains (losses) 12 (4) – 8
Currency translation (4) (3) – (7)
Other (3) 6 1 4
Balance at December 31, 2011 280 116 3 399
Purchases 13 15 – 28
Sales (21) (7) – (28)
Net transfers in from Level 2 69 – – 69
Realized gains (losses) 1 4 – 5
Unrealized gains (losses) (25) (1) – (26)
Currency translation 15 4 – 19
Balance at December 31, 2012 $ 332 $ 131 $ 3 $ 466
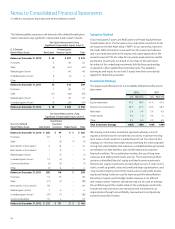
Valuation Method
Our primary Level 3 assets are Real Estate and Private Equity/Venture
Capital investments. The fair value of our real estate investment funds
are based on the Net Asset Value (“NAV”) of our ownership interest in
the funds. NAV information is received from the investment advisers
and is primarily derived from third-party real estate appraisals for the
properties owned. The fair value for our private equity/venture capital
partnership investments are based on our share of the estimated
fair values of the underlying investments held by these partnerships
as reported in their audited financial statements. The valuation
techniques and inputs for our Level 3 assets have been consistently
applied for all periods presented.
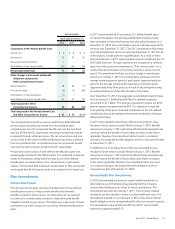
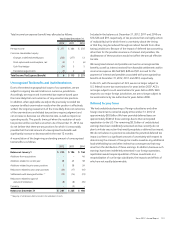
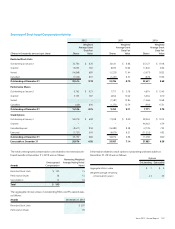
Investment Strategy
The target asset allocations for our worldwide defined benefit pension
plans were:
2012 2011
U.S. Non-U.S. U.S. Non-U.S.
Equity investments 41% 40% 41% 41%
Fixed income investments 43% 47% 43% 46%
Real estate 5% 9% 5% 9%
Private equity 9% –% 9% –%
Other 2% 4% 2% 4%
Total Investment Strategy 100% 100% 100% 100%
We employ a total return investment approach whereby a mix of
equities and fixed income investments are used to maximize the long-
term return of plan assets for a prudent level of risk. The intent of this
strategy is to minimize plan expenses by exceeding the interest growth
in long-term plan liabilities. Risk tolerance is established through careful
consideration of plan liabilities, plan funded status and corporate
financial condition. This consideration involves the use of long-term
measures that address both return and risk. The investment portfolio
contains a diversified blend of equity and fixed income investments.
Furthermore, equity investments are diversified across U.S. and non-U.S.
stocks, as well as growth, value and small and large capitalizations, and
may include Company stock. Other assets such as real estate, private
equity and hedge funds are used to improve portfolio diversification.
Derivatives may be used to hedge market exposure in an efficient
and timely manner; however, derivatives may not be used to leverage
the portfolio beyond the market value of the underlying investments.
Investment risks and returns are measured and monitored on an
ongoing basis through annual liability measurements and quarterly
investment portfolio reviews.