Xerox 2012 Annual Report Download - page 37
Download and view the complete annual report
Please find page 37 of the 2012 Xerox annual report below. You can navigate through the pages in the report by either clicking on the pages listed below, or by using the keyword search tool below to find specific information within the annual report.-
 1
1 -
2
-
3
-
4
-
5
-
6
-
7
-
8
-
9
-
10
-
11
-
12
-
13
-
14
-
15
-
16
-
17
-
18
-
19
-
20
-
21
-
22
-
23
-
24
-
25
-
26
-
 27
27 -
 28
28 -
 29
29 -
 30
30 -
 31
31 -
 32
32 -
 33
33 -
 34
34 -
 35
35 -
 36
36 -
 37
37 -
 38
38 -
 39
39 -
 40
40 -
 41
41 -
 42
42 -
 43
43 -
 44
44 -
 45
45 -
 46
46 -
 47
47 -
48
-
49
-
50
-
51
-
52
-
53
-
54
-
55
-
56
-
57
-
58
-
59
-
60
-
61
-
62
-
63
-
64
-
65
-
66
-
67
-
68
-
69
-
70
-
71
-
72
-
73
-
74
-
75
-
76
-
77
-
78
-
79
-
80
-
81
-
82
-
83
-
84
-
85
-
86
-
87
-
88
-
89
-
90
-
91
-
92
-
93
-
94
-
95
-
96
-
97
-
98
-
99
-
100
-
101
-
102
-
103
-
104
-
105
-
106
-
107
-
108
-
109
-
110
-
111
-
112
-
113
-
114
-
115
-
116
-
117
-
118
-
119
-
120
 |
 |

35Xerox 2012 Annual Report
Operating Margin
The operating margin1 for the year ended December 31, 2012 of 9.3%
decreased 0.5-percentage points as compared to 2011. The decline,
which was primarily in our Services segment due to a decrease in gross
margin, was partially offset by expense reductions.
The operating margin1 for the year ended December 31, 2011 of 9.8%
increased 0.2-percentage points, or 0.3-percentage points on a pro-
forma1 basis, as compared to 2010. The increase was due primarily to
disciplined cost and expense management.
Note: The acquisition of ACS increased the proportion of our revenue
from services, which has a lower gross margin and SAG as a percent
of revenue than we historically experienced when Xerox was primarily
a technology company. As a result, in 2011 gross margins and SAG
are also discussed below on a pro-forma basis where we adjust our
historical 2010 results to include ACS’s 2010 estimated results for
the period from January 1 through February 5, 2010. Refer to the
“Non-GAAP Financial Measures” section for a further explanation and
discussion of this non-GAAP presentation.
Gross Margin
Gross margin for year ended December 31, 2012 of 31.4% decreased
1.4-percentage points as compared to 2011. The decrease was driven
by the overall mix of services revenue, the ramping of new services
contracts and pressure on government contracts, particularly in the
third quarter 2012. These negative impacts were partially offset by
productivity improvements and cost savings from restructuring.
Gross margin for year ended December 31, 2011 of 32.8% decreased
1.6-percentage points, or 1.1-percentage points on a pro-forma1 basis,
as compared to 2010. The decrease was driven by the ramping of new
services contracts, the impact of lower contract renewals, transaction
currency and the mix of higher services revenue.
Services gross margin for the year ended December 31, 2012
decreased 1.7-percentage points as compared to 2011. The decrease
is primarily due to the ramping of new services contracts within BPO
and ITO and pressure on government contracts, particularly in the third
quarter 2012.
Services gross margin for the year ended December 31, 2011
decreased 1.7-percentage points, or 1.2 percentage points, on a pro-
forma1 basis, as compared to 2010. The decrease is primarily due to
the ramping of new services contracts within BPO and ITO and the
impact of lower contract renewals.
Document Technology gross margin for the year ended December
31, 2012 increased by 0.1-percentage points as compared to 2011.
Productivity improvements, restructuring savings and gains recognized
on the sales of finance receivables (see Note 5 – Finance Receivables,
Net in the Consolidated Financial Statements for additional
information) more than offset the impact of price declines, product mix
and the unfavorable year-over-year impact of transaction currency.
Document Technology gross margin for the year ended December
31, 2011 decreased by 0.9-percentage points as compared to 2010
due to the impact of price declines and the negative year-over-year
impact of transaction currency. The decline was partially offset by cost
productivities and restructuring savings which reflect our continued
focus on cost management.
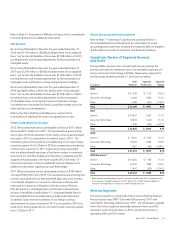
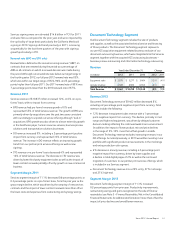
Research, Development and Engineering Expenses (“RD&E”)
Year Ended December 31, Change
(in millions) 2012 2011 2010 2012 2011
R&D $ 545 $ 613 $ 653 $ (68) $ (40)
Sustaining engineering 110 108 128 2 (20)
Total RD&E Expenses $ 655 $ 721 $ 781 $ (66) $ (60)
R&D Investment by Fuji Xerox(1) $ 860 $ 880 $ 821 $ (20) $ 59
(1) Fluctuation in Fuji Xerox R&D was primarily due to changes in foreign exchange rates.