Xerox 2012 Annual Report Download - page 54
Download and view the complete annual report
Please find page 54 of the 2012 Xerox annual report below. You can navigate through the pages in the report by either clicking on the pages listed below, or by using the keyword search tool below to find specific information within the annual report.-
 1
1 -
2
-
3
-
4
-
5
-
6
-
7
-
8
-
9
-
10
-
11
-
12
-
13
-
14
-
15
-
16
-
17
-
18
-
19
-
20
-
21
-
22
-
23
-
24
-
25
-
26
-
27
-
28
-
29
-
30
-
31
-
32
-
33
-
34
-
35
-
36
-
37
-
38
-
39
-
40
-
41
-
42
-
43
-
 44
44 -
 45
45 -
 46
46 -
 47
47 -
 48
48 -
 49
49 -
 50
50 -
 51
51 -
 52
52 -
 53
53 -
 54
54 -
 55
55 -
 56
56 -
 57
57 -
 58
58 -
 59
59 -
 60
60 -
 61
61 -
 62
62 -
 63
63 -
 64
64 -
65
-
66
-
67
-
68
-
69
-
70
-
71
-
72
-
73
-
74
-
75
-
76
-
77
-
78
-
79
-
80
-
81
-
82
-
83
-
84
-
85
-
86
-
87
-
88
-
89
-
90
-
91
-
92
-
93
-
94
-
95
-
96
-
97
-
98
-
99
-
100
-
101
-
102
-
103
-
104
-
105
-
106
-
107
-
108
-
109
-
110
-
111
-
112
-
113
-
114
-
115
-
116
-
117
-
118
-
119
-
120
 |
 |

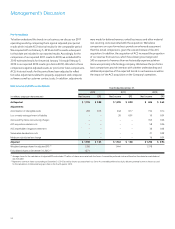
Management’s Discussion
52
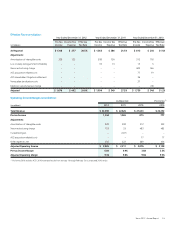
Net Income and EPS reconciliation: Year Ended December 31,
2012 2011 2010
(in millions; except per share amounts) Net Income EPS Net Income EPS Net Income EPS
As Reported $ 1,195 $ 0.88 $ 1,295 $ 0.90 $ 606 $ 0.43
Adjustments:
Amortization of intangible assets 203 0.15 248 0.17 194 0.14
Loss on early extinguishment of liability – – 20 0.01 10 0.01
Xerox and Fuji Xerox restructuring charges – – – – 355 0.26
ACS acquisition-related costs – – – – 58 0.04
ACS shareholders’ litigation settlement – – – – 36 0.03
Venezuelan devaluation costs – – – – 21 0.02
Medicare subsidy tax law change – – – – 16 0.01
Adjusted $ 1,398 $ 1.03 $ 1,563 $ 1.08 $ 1,296 $ 0.94
Weighted average shares for adjusted EPS (1) 1,356 1,444 1,378
Fully diluted shares at December 31, 2012 (2) 1,271
(1) Average shares for the calculation of adjusted EPS and include 27 million of shares associated with the Series A convertible preferred stock and therefore the related annual dividend
was excluded.
(2) Represents common shares outstanding at December 31, 2012 as well as shares associated with our Series A convertible preferred stock plus dilutive potential common shares as used
for the calculation of diluted earnings per share in the fourth quarter 2012.
Pro-forma Basis
To better understand the trends in our business, we discuss our 2011
operating results by comparing them against adjusted prior period
results which include ACS historical results for the comparable period.
We acquired ACS on February 5, 2010 and ACS’s results subsequent
to that date are included in our reported results. Accordingly, for the
comparison of our reported 2011 results to 2010, we included ACS’s
2010 estimated results for the period January 1 through February 5,
2010 in our reported 2010 results (pro-forma 2010). We refer to these
comparisons against adjusted results as “pro-forma” basis comparisons.
ACS’s historical results for this period have been adjusted to reflect
fair value adjustments related to property, equipment and computer
software as well as customer contract costs. In addition, adjustments
were made for deferred revenue, exited businesses and other material
non-recurring costs associated with the acquisition. We believe
comparisons on a pro-forma basis provide an enhanced assessment
than the actual comparisons, given the size and nature of the ACS
acquisition. In addition, the acquisition of ACS increased the proportion
of our revenue from services, which has a lower gross margin and
SAG as a percent of revenue than we historically experienced when
Xerox was primarily a Technology company. We believe the pro-forma
basis comparisons provide investors with a better understanding and
additional perspective of the expected trends in our business as well as
the impact of the ACS acquisition on the Company’s operations.