Xerox 2012 Annual Report Download - page 73
Download and view the complete annual report
Please find page 73 of the 2012 Xerox annual report below. You can navigate through the pages in the report by either clicking on the pages listed below, or by using the keyword search tool below to find specific information within the annual report.-
 1
1 -
2
-
3
-
4
-
5
-
6
-
7
-
8
-
9
-
10
-
11
-
12
-
13
-
14
-
15
-
16
-
17
-
18
-
19
-
20
-
21
-
22
-
23
-
24
-
25
-
26
-
27
-
28
-
29
-
30
-
31
-
32
-
33
-
34
-
35
-
36
-
37
-
38
-
39
-
40
-
41
-
42
-
43
-
44
-
45
-
46
-
47
-
48
-
49
-
50
-
51
-
52
-
53
-
54
-
55
-
56
-
57
-
58
-
59
-
60
-
61
-
62
-
 63
63 -
 64
64 -
 65
65 -
 66
66 -
 67
67 -
 68
68 -
 69
69 -
 70
70 -
 71
71 -
 72
72 -
 73
73 -
 74
74 -
 75
75 -
 76
76 -
 77
77 -
 78
78 -
 79
79 -
 80
80 -
 81
81 -
 82
82 -
 83
83 -
84
-
85
-
86
-
87
-
88
-
89
-
90
-
91
-
92
-
93
-
94
-
95
-
96
-
97
-
98
-
99
-
100
-
101
-
102
-
103
-
104
-
105
-
106
-
107
-
108
-
109
-
110
-
111
-
112
-
113
-
114
-
115
-
116
-
117
-
118
-
119
-
120
 |
 |
71Xerox 2012 Annual Report
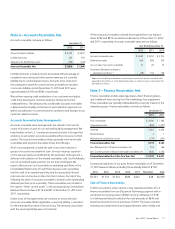
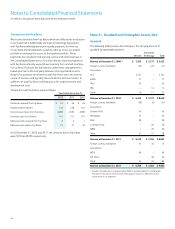
Note 4 – Accounts Receivable, Net
Accounts receivable, net were as follows:
December 31,
2012 2011
Amounts billed or billable $ 2,639 $ 2,307
Unbilled amounts 335 395
Allowance for doubtful accounts (108) (102)
Accounts Receivable, Net $ 2,866 $ 2,600
Unbilled amounts include amounts associated with percentage-of-
completion accounting and other earned revenues not currently
billable due to contractual provisions. Amounts to be invoiced in
the subsequent month for current services provided are included
in amounts billable, and at December 31, 2012 and 2011 were
approximately $1,049 and $963, respectively.
We perform ongoing credit evaluations of our customers and adjust
credit limits based upon customer payment history and current
creditworthiness. The allowance for uncollectible accounts receivables
is determined principally on the basis of past collection experience as
well as consideration of current economic conditions and changes in our
customer collection trends.
Accounts Receivable Sales Arrangements
Accounts receivable sales arrangements are utilized in the normal
course of business as part of our cash and liquidity management. We
have facilities in the U.S., Canada and several countries in Europe that
enable us to sell certain accounts receivable without recourse to third-
parties. The accounts receivables sold are generally short-term trade
receivables with payment due dates of less than 60 days.
All of our arrangements involve the sale of our entire interest in
groups of accounts receivable for cash. In most instances a portion
of the sales proceeds are held back by the purchaser and payment is
deferred until collection of the related receivables sold. Such holdbacks
are not considered legal securities nor are they certificated. We
report collections on such receivables as operating cash flows in the
Consolidated Statements of Cash Flows because such receivables
are the result of an operating activity and the associated interest
rate risk is de minimis due to their short-term nature. Our risk of loss
following the sales of accounts receivable is limited to the outstanding
deferred purchase price receivable. These receivables are included in
the caption “Other current assets” in the accompanying Consolidated
Balance Sheets and were $116 and $97 at December 31, 2012 and
2011, respectively.
Under most of the agreements, we continue to service the sold
accounts receivable. When applicable, a servicing liability is recorded
for the estimated fair value of the servicing. The amounts associated
with the servicing liability were not material.
Of the accounts receivables sold and derecognized from our balance
sheet, $766 and $815 remained uncollected as of December 31, 2012
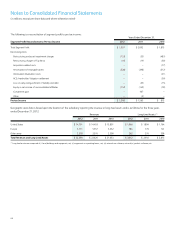
and 2011, respectively. Accounts receivable sales were as follows:
Year Ended December 31,
2012 2011 2010
Accounts receivable sales $ 3,699 $ 3,218 $ 2,374
Deferred proceeds 639 386 307
Loss on sale of accounts receivables 21 20 15
Estimated (decrease) increase to
operating cash flows (1) (78) 133 106
(1) Represents the difference between current and prior year fourth quarter receivable sales
adjusted for the effects of: (i) the deferred proceeds, (ii) collections prior to the end of the
year and (iii) currency.
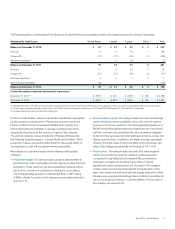
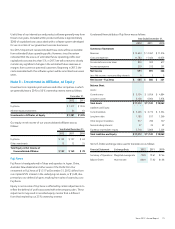
Note 5 – Finance Receivables, Net
Finance receivables include sales-type leases, direct financing leases
and installment loans arising from the marketing of our equipment.
These receivables are typically collateralized by a security interest in the
underlying assets. Finance receivables, net were as follows:
December 31,
2012 2011
Gross receivables $ 6,290 $ 7,583
Unearned income (809) (1,027)
Subtotal 5,481 6,556
Residual values 2 7
Allowance for doubtful accounts (170) (201)
Finance Receivables, Net 5,313 6,362
Less: Billed portion of finance receivables, net 152 166
Less: Current portion of finance receivables not billed, net 1,836 2,165
Finance Receivables Due After One Year, Net $ 3,325 $ 4,031
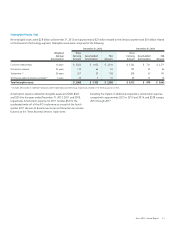
Contractual maturities of our gross finance receivables as of December
31, 2012 were as follows (including those already billed of $152):
2013 2014 2015 2016 2017 Thereafter Total
$2,353 $1,753 $1,234 $680 $242 $28 $6,290
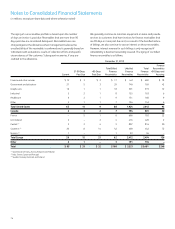
Sale of Finance Receivables
In 2012, we sold our entire interest in two separate portfolios of U.S.
finance receivables from our Document Technology segment with a
combined net carrying value of $682 (net of an allowance of $18)
to a third-party financial institution for cash proceeds of $630 and
beneficial interests from the purchaser of $101. The lease contracts,
including associated service and supply elements, were initially sold