Xerox 2012 Annual Report Download - page 69
Download and view the complete annual report
Please find page 69 of the 2012 Xerox annual report below. You can navigate through the pages in the report by either clicking on the pages listed below, or by using the keyword search tool below to find specific information within the annual report.-
 1
1 -
2
-
3
-
4
-
5
-
6
-
7
-
8
-
9
-
10
-
11
-
12
-
13
-
14
-
15
-
16
-
17
-
18
-
19
-
20
-
21
-
22
-
23
-
24
-
25
-
26
-
27
-
28
-
29
-
30
-
31
-
32
-
33
-
34
-
35
-
36
-
37
-
38
-
39
-
40
-
41
-
42
-
43
-
44
-
45
-
46
-
47
-
48
-
49
-
50
-
51
-
52
-
53
-
54
-
55
-
56
-
57
-
58
-
 59
59 -
 60
60 -
 61
61 -
 62
62 -
 63
63 -
 64
64 -
 65
65 -
 66
66 -
 67
67 -
 68
68 -
 69
69 -
 70
70 -
 71
71 -
 72
72 -
 73
73 -
 74
74 -
 75
75 -
 76
76 -
 77
77 -
 78
78 -
 79
79 -
80
-
81
-
82
-
83
-
84
-
85
-
86
-
87
-
88
-
89
-
90
-
91
-
92
-
93
-
94
-
95
-
96
-
97
-
98
-
99
-
100
-
101
-
102
-
103
-
104
-
105
-
106
-
107
-
108
-
109
-
110
-
111
-
112
-
113
-
114
-
115
-
116
-
117
-
118
-
119
-
120
 |
 |
67Xerox 2012 Annual Report
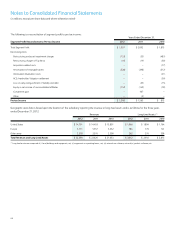
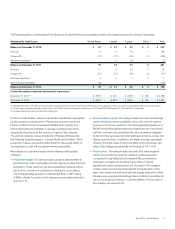
Selected financial information for our Operating segments was as follows:
Years Ended December 31,
Document
Services Tech nology Other Total
2012 (1)
Revenue $ 11,453 $ 8,951 $ 1,389 $ 21,793
Finance income 75 511 11 597
Total Segment Revenue $ 11,528 $ 9,462 $ 1,400 $ 22,390
Interest expense 22 172 234 428
Segment profit (loss) (2) 1,173 1,065 (241) 1,997
Equity in net income of unconsolidated affiliates 30 122 – 152
2011(1)
Revenue $ 10,754 $ 9,722 $ 1,518 $ 21,994
Finance income 83 537 12 632
Total Segment Revenue $ 10,837 $ 10,259 $ 1,530 $ 22,626
Interest expense $ 25 $ 202 $ 251 $ 478
Segment profit (loss) (2) 1,207 1,140 (255) 2,092
Equity in net income of unconsolidated affiliates 31 118 – 149
2010 (1)
Revenue $ 9,548 $ 9,790 $ 1,635 $ 20,973
Finance income 89 559 12 660
Total Segment Revenue $ 9,637 $ 10,349 $ 1,647 $ 21,633
Interest expense $ 28 $ 212 $ 352 $ 592
Segment profit (loss) (2) 1,132 1,085 (342) 1,875
Equity in net income of unconsolidated affiliates 16 62 – 78
(1) Asset information on a segment basis is not disclosed as this information is not separately identified and internally reported to our chief executive officer.
(2) Depreciation and amortization expense, which is recorded in Cost of Sales, Services, RD&E and SAG are included in segment profit above. This information is neither identified nor internally
reported to our chief executive officer. The separate identification of this information for purposes of segment disclosure is impracticable, as it is not readily available and the cost to develop
it would be excessive.
Our Document Technology segment is centered on strategic product
groups, which share common technology, manufacturing and product
platforms. This segment includes the sale of document systems and
supplies, technical services and product financing. Our products range
from:
• Entry, which includes A4 devices and desktop printers; to
• Mid-range, which includes A3 devices that generally serve
workgroup environments in mid to large enterprises and includes
products that fall into the following market categories: Color 41+
ppm priced at less than $100K and Light Production 91+ ppm priced
at less than $100K; to
• High-end, which includes production printing and publishing
systems that generally serve the graphic communications
marketplace and large enterprises.
The segment classified as Other includes several units, none of
which meet the thresholds for separate segment reporting. This
group primarily includes Global Paper and Supplies Distribution
Group (predominantly paper sales), licensing revenues, GIS network
integration solutions and electronic presentation systems and non-
allocated Corporate items including non-financing interest, as well as
other items included in Other expenses, net.