Xerox 2012 Annual Report Download - page 85
Download and view the complete annual report
Please find page 85 of the 2012 Xerox annual report below. You can navigate through the pages in the report by either clicking on the pages listed below, or by using the keyword search tool below to find specific information within the annual report.-
 1
1 -
2
-
3
-
4
-
5
-
6
-
7
-
8
-
9
-
10
-
11
-
12
-
13
-
14
-
15
-
16
-
17
-
18
-
19
-
20
-
21
-
22
-
23
-
24
-
25
-
26
-
27
-
28
-
29
-
30
-
31
-
32
-
33
-
34
-
35
-
36
-
37
-
38
-
39
-
40
-
41
-
42
-
43
-
44
-
45
-
46
-
47
-
48
-
49
-
50
-
51
-
52
-
53
-
54
-
55
-
56
-
57
-
58
-
59
-
60
-
61
-
62
-
63
-
64
-
65
-
66
-
67
-
68
-
69
-
70
-
71
-
72
-
73
-
74
-
 75
75 -
 76
76 -
 77
77 -
 78
78 -
 79
79 -
 80
80 -
 81
81 -
 82
82 -
 83
83 -
 84
84 -
 85
85 -
 86
86 -
 87
87 -
 88
88 -
 89
89 -
 90
90 -
 91
91 -
 92
92 -
 93
93 -
 94
94 -
 95
95 -
96
-
97
-
98
-
99
-
100
-
101
-
102
-
103
-
104
-
105
-
106
-
107
-
108
-
109
-
110
-
111
-
112
-
113
-
114
-
115
-
116
-
117
-
118
-
119
-
120
 |
 |

83Xerox 2012 Annual Report
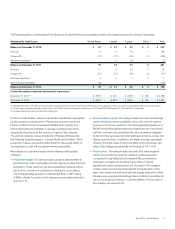
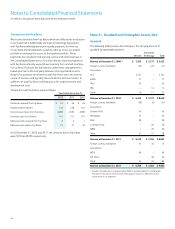
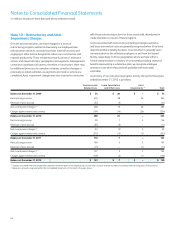
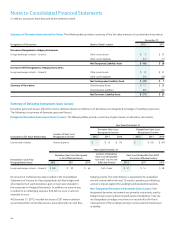
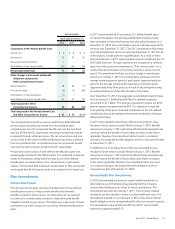
The following table summarizes the reconciliation to the Consolidated
Statements of Cash Flows:
Year Ended December 31,
2012 2011 2010
Charges against reserve $ (146) $ (233) $ (234)
Asset impairment 1 5 26
Effects of foreign currency and
other non-cash items 1 10 (5)
Restructuring Cash Payments $ (144) $ (218) $ (213)
The following table summarizes the total amount of costs incurred in
connection with these restructuring programs by segment:
Year Ended December 31,
2012 2011 2010
Services $ 71 $ 12 $ 104
Document Technology 82 23 325
Other – (2) 54
Total Net Restructuring Charges $ 153 $ 33 $ 483
Refer to the “Restructuring and Asset Impairment Charges” section of
our MD&A for additional discussion of net restructuring charges for the
three years ended December 31, 2012.
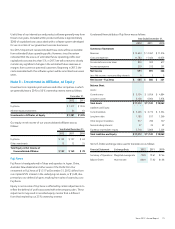
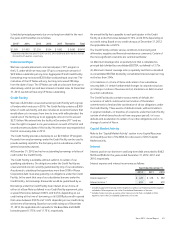
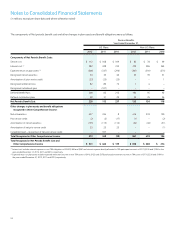
Note 11 – Supplementary Financial Information
The components of other current and long-term assets and liabilities
were as follows:
December 31,
2012 2011
Other Current Assets
Deferred taxes and income taxes receivable $ 296 $ 261
Royalties, license fees and software maintenance 165 143
Restricted cash 151 97
Prepaid expenses 143 147
Derivative instruments 11 58
Deferred purchase price from sales of accounts receivables 116 97
Beneficial interests – sales of finance receivables 35 –
Advances and deposits 29 28
Other 216 227
Total Other Current Assets $ 1,162 $ 1,058
December 31,
(continued) 2012 2011
Other Current Liabilities
Deferred taxes and income taxes payable $ 105 $ 83
Other taxes payable 170 150
Interest payable 83 84
Restructuring reserves 122 116
Derivative instruments 82 31
Product warranties 13 15
Dividends payable 69 74
Distributor and reseller rebates/commissions 117 112
Servicer liabilities 146 88
Other 869 878
Total Other Current Liabilities $ 1,776 $ 1,631
Other Long-term Assets
Prepaid pension costs $ 35 $ 76
Net investment in discontinued operations 190 204
Internal use software, net 577 545
Product software, net 344 256
Restricted cash 214 246
Debt issuance costs, net 37 38
Customer contract costs, net 356 294
Beneficial interests – sales of finance receivables 68 –
Deferred compensation plan investments 100 92
Other 416 365
Total Other Long-term Assets $ 2,337 $ 2,116
Other Long-term Liabilities
Deferred and other tax liabilities $ 262 $ 290
Environmental reserves 14 16
Unearned income 134 82
Restructuring reserves 8 7
Other 360 466
Total Other Long-term Liabilities $ 778 $ 861