Xerox 2012 Annual Report Download - page 91
Download and view the complete annual report
Please find page 91 of the 2012 Xerox annual report below. You can navigate through the pages in the report by either clicking on the pages listed below, or by using the keyword search tool below to find specific information within the annual report.-
 1
1 -
2
-
3
-
4
-
5
-
6
-
7
-
8
-
9
-
10
-
11
-
12
-
13
-
14
-
15
-
16
-
17
-
18
-
19
-
20
-
21
-
22
-
23
-
24
-
25
-
26
-
27
-
28
-
29
-
30
-
31
-
32
-
33
-
34
-
35
-
36
-
37
-
38
-
39
-
40
-
41
-
42
-
43
-
44
-
45
-
46
-
47
-
48
-
49
-
50
-
51
-
52
-
53
-
54
-
55
-
56
-
57
-
58
-
59
-
60
-
61
-
62
-
63
-
64
-
65
-
66
-
67
-
68
-
69
-
70
-
71
-
72
-
73
-
74
-
75
-
76
-
77
-
78
-
79
-
80
-
 81
81 -
 82
82 -
 83
83 -
 84
84 -
 85
85 -
 86
86 -
 87
87 -
 88
88 -
 89
89 -
 90
90 -
 91
91 -
 92
92 -
 93
93 -
 94
94 -
 95
95 -
 96
96 -
 97
97 -
 98
98 -
 99
99 -
 100
100 -
 101
101 -
102
-
103
-
104
-
105
-
106
-
107
-
108
-
109
-
110
-
111
-
112
-
113
-
114
-
115
-
116
-
117
-
118
-
119
-
120
 |
 |

89Xerox 2012 Annual Report
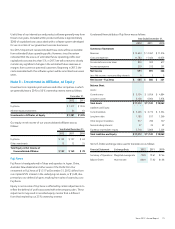
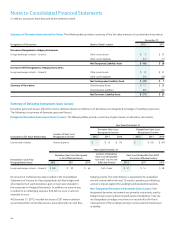
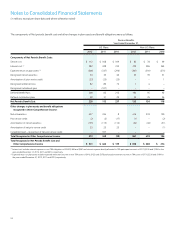
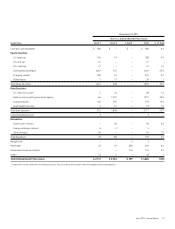
The following table provides a summary of gains (losses) on non-designated derivative instruments:
Year Ended December 31,
Derivatives NOT Designated as Hedging Instruments Location of Derivative (Loss) Gain 2012 2011 2010
Foreign exchange contracts – forwards Other expense – Currency (losses) gains, net $ (38) $ 33 $ 113
During the three years ended December 31, 2012, we recorded Currency losses, net of $3, $12 and $11, respectively. Currency losses, net includes
the mark-to-market adjustments of the derivatives not designated as hedging instruments and the related cost of those derivatives, as well as the
re-measurement of foreign currency-denominated assets and liabilities.
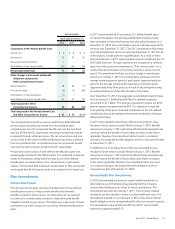
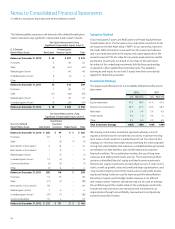
Note 14 – Fair Value of Financial Assets
and Liabilities
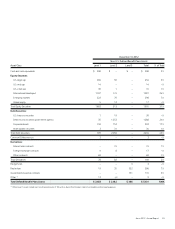
The following table represents assets and liabilities fair value measured
on a recurring basis. The basis for the measurement at fair value in all
cases is Level 2 – Significant Other Observable Inputs.
As of December 31,
2012 2011
Assets:
Foreign exchange contracts – forwards $ 11 $ 58
Deferred compensation investments in
cash surrender life insurance 77 69
Deferred compensation investments in mutual funds 23 23
Total $ 111 $ 150
Liabilities:
Foreign exchange contracts – forwards $ 82 $ 31
Deferred compensation plan liabilities 110 97
Total $ 192 $ 128
We utilize the income approach to measure the fair value for our
derivative assets and liabilities. The income approach uses pricing
models that rely on market observable inputs such as yield curves,
currency exchange rates and forward prices, and therefore are classified
as Level 2.
Fair value for our deferred compensation plan investments in
Company-owned life insurance is reflected at cash surrender value.
Fair value for our deferred compensation plan investments in mutual
funds is based on quoted market prices for actively traded investments
similar to those held by the plan. Fair value for deferred compensation
plan liabilities is based on the fair value of investments corresponding
to employees’ investment selections, based on quoted prices for similar
assets in actively traded markets.
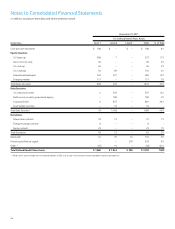
Summary of Other Financial Assets and Liabilities Fair
Value Measured on a Nonrecurring Basis
The estimated fair values of our other financial assets and liabilities fair
value measured on a nonrecurring basis were as follows:
December 31, 2012 December 31, 2011
Carrying Fair Carrying Fair
Amount Value Amount Value
Cash and cash equivalents $ 1,246 $ 1,246 $ 902 $ 902
Accounts receivable, net 2,866 2,866 2,600 2,600
Short-term debt 1,042 1,051 1,545 1,622
Long-term debt 7,447 8,040 7,088 7,496
The fair value amounts for Cash and cash equivalents and Accounts
receivable, net, approximate carrying amounts due to the short
maturities of these instruments. The fair value of Short- and Long-term
debt was estimated based on quoted market prices for publicly traded
securities (Level 1) or on the current rates offered to us for debt of
similar maturities (Level 2). The difference between the fair value and
the carrying value represents the theoretical net premium or discount
we would pay or receive to retire all debt at such date.