Xerox 2012 Annual Report Download - page 94
Download and view the complete annual report
Please find page 94 of the 2012 Xerox annual report below. You can navigate through the pages in the report by either clicking on the pages listed below, or by using the keyword search tool below to find specific information within the annual report.-
 1
1 -
2
-
3
-
4
-
5
-
6
-
7
-
8
-
9
-
10
-
11
-
12
-
13
-
14
-
15
-
16
-
17
-
18
-
19
-
20
-
21
-
22
-
23
-
24
-
25
-
26
-
27
-
28
-
29
-
30
-
31
-
32
-
33
-
34
-
35
-
36
-
37
-
38
-
39
-
40
-
41
-
42
-
43
-
44
-
45
-
46
-
47
-
48
-
49
-
50
-
51
-
52
-
53
-
54
-
55
-
56
-
57
-
58
-
59
-
60
-
61
-
62
-
63
-
64
-
65
-
66
-
67
-
68
-
69
-
70
-
71
-
72
-
73
-
74
-
75
-
76
-
77
-
78
-
79
-
80
-
81
-
82
-
83
-
 84
84 -
 85
85 -
 86
86 -
 87
87 -
 88
88 -
 89
89 -
 90
90 -
 91
91 -
 92
92 -
 93
93 -
 94
94 -
 95
95 -
 96
96 -
 97
97 -
 98
98 -
 99
99 -
 100
100 -
 101
101 -
 102
102 -
 103
103 -
 104
104 -
105
-
106
-
107
-
108
-
109
-
110
-
111
-
112
-
113
-
114
-
115
-
116
-
117
-
118
-
119
-
120
 |
 |

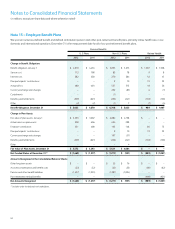
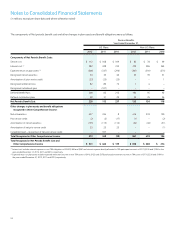
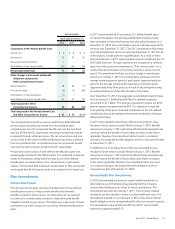
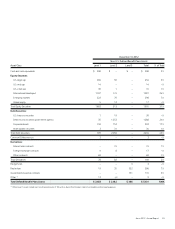
Notes to Consolidated Financial Statements
(in millions, except per-share data and where otherwise noted)
92
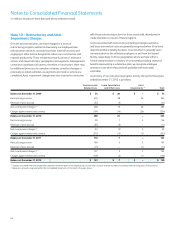
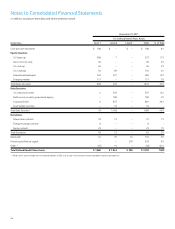
The components of Net periodic benefit cost and other changes in plan assets and benefit obligations were as follows:
Pension Benefits
Year Ended December 31,
U.S. Plans Non-U.S. Plans
2012 2011 2010 2012 2011 2010
Components of Net Periodic Benefit Costs:
Service cost $ 112 $ 108 $ 109 $ 83 $ 78 $ 69
Interest cost (1) 282 328 310 270 284 265
Expected return on plan assets (2) (306) (337) (296) (307) (310) (274)
Recognized net actuarial loss 53 33 40 53 39 31
Amortization of prior service credit (23) (23) (23) – – 1
Recognized settlement loss 82 80 72 1 4 –
Recognized curtailment gain – (107) – – – –
Defined Benefit Plans 200 82 212 100 95 92
Defined contribution plans 28 31 25 35 35 26
Net Periodic Benefit Cost 228 113 237 135 130 118
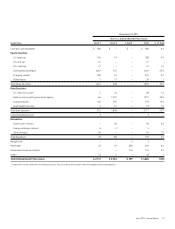
Other changes in plan assets and benefit obligations
recognized in Other Comprehensive Income:
Net actuarial loss 427 334 8 416 518 190
Prior service credit (2) (2) (17) (1) – (2)
Amortization of net actuarial loss (135) (113) (112) (54) (40) (31)
Amortization of net prior service credit 23 23 23 – – (1)
Curtailment gain – recognition of net prior service credit – 107 – – – –
Total Recognized in Other Comprehensive Income 313 349 (98) 361 478 156
Total Recognized in Net Periodic Benefit Cost and
Other Comprehensive Income $ 541 $ 462 $ 139 $ 496 $ 608 $ 274
(1) Interest cost includes interest expense on non-TRA obligations of $382, $388 and $381 and interest expense directly allocated to TRA participant accounts of $170, $224 and $194 for the
years ended December 31, 2012, 2011 and 2010, respectively.
(2) Expected return on plan assets includes expected investment income on non-TRA assets of $443, $423 and $376 and actual investment income on TRA assets of $170, $224 and $194 for
the years ended December 31, 2012, 2011 and 2010, respectively.