Xerox 2012 Annual Report Download - page 115
Download and view the complete annual report
Please find page 115 of the 2012 Xerox annual report below. You can navigate through the pages in the report by either clicking on the pages listed below, or by using the keyword search tool below to find specific information within the annual report.-
 1
1 -
2
-
3
-
4
-
5
-
6
-
7
-
8
-
9
-
10
-
11
-
12
-
13
-
14
-
15
-
16
-
17
-
18
-
19
-
20
-
21
-
22
-
23
-
24
-
25
-
26
-
27
-
28
-
29
-
30
-
31
-
32
-
33
-
34
-
35
-
36
-
37
-
38
-
39
-
40
-
41
-
42
-
43
-
44
-
45
-
46
-
47
-
48
-
49
-
50
-
51
-
52
-
53
-
54
-
55
-
56
-
57
-
58
-
59
-
60
-
61
-
62
-
63
-
64
-
65
-
66
-
67
-
68
-
69
-
70
-
71
-
72
-
73
-
74
-
75
-
76
-
77
-
78
-
79
-
80
-
81
-
82
-
83
-
84
-
85
-
86
-
87
-
88
-
89
-
90
-
91
-
92
-
93
-
94
-
95
-
96
-
97
-
98
-
99
-
100
-
101
-
102
-
103
-
104
-
 105
105 -
 106
106 -
 107
107 -
 108
108 -
 109
109 -
 110
110 -
 111
111 -
 112
112 -
 113
113 -
 114
114 -
 115
115 -
 116
116 -
 117
117 -
 118
118 -
 119
119 -
 120
120
 |
 |

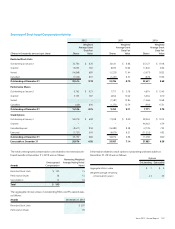
113Xerox 2012 Annual Report
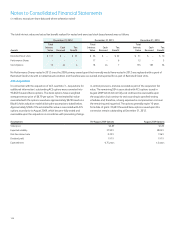
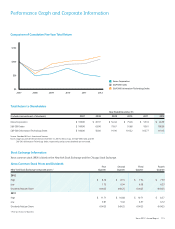
Quarterly Results of Operations (Unaudited)
(in millions, except per-share data)
First Second Third Fourth Full
Quarter Quarter Quarter Quarter Year
2012
Revenues $ 5,503 $ 5,541 $ 5,423 $ 5,923 $ 22,390
Costs and Expenses 5,190 5,190 5,106 5,556 21,042
Income Before Income Taxes and Equity Income 313 351 317 367 1,348
Income tax expenses 77 66 63 71 277
Equity in net income of unconsolidated affiliates 40 31 34 47 152
Net Income 276 316 288 343 1,223
Less: Net income – noncontrolling interests 7 7 6 8 28
Net Income Attributable to Xerox $ 269 $ 309 $ 282 $ 335 $ 1,195
Basic Earnings per Share (1) $ 0.20 $ 0.23 $ 0.21 $ 0.26 $ 0.90
Diluted Earnings per Share (1) 0.19 0.22 0.21 0.26 0.88
2011
Revenues $ 5,465 $ 5,614 $ 5,583 $ 5,964 $ 22,626
Costs and Expenses 5,115 5,213 5,216 5,517 21,061
Income Before Income Taxes and Equity Income 350 401 367 447 1,565
Income tax expenses 95 108 81 102 386
Equity in net income of unconsolidated affiliates 34 34 43 38 149
Net Income 289 327 329 383 1,328
Less: Net income – noncontrolling interests 8 8 9 8 33
Net Income Attributable to Xerox $ 281 $ 319 $ 320 $ 375 $ 1,295
Basic Earnings per Share (1) $ 0.20 $ 0.22 $ 0.23 $ 0.27 $ 0.92
Diluted Earnings per Share (1) 0.19 0.22 0.22 0.26 0.90
(1)
The sum of quarterly earnings per share may differ from the full-year amounts due to rounding, or in the case of diluted earnings per share, because securities that are anti-dilutive in certain
quarters may not be anti-dilutive on a full-year basis.