Xerox 2012 Annual Report Download - page 36
Download and view the complete annual report
Please find page 36 of the 2012 Xerox annual report below. You can navigate through the pages in the report by either clicking on the pages listed below, or by using the keyword search tool below to find specific information within the annual report.-
 1
1 -
2
-
3
-
4
-
5
-
6
-
7
-
8
-
9
-
10
-
11
-
12
-
13
-
14
-
15
-
16
-
17
-
18
-
19
-
20
-
21
-
22
-
23
-
24
-
25
-
 26
26 -
 27
27 -
 28
28 -
 29
29 -
 30
30 -
 31
31 -
 32
32 -
 33
33 -
 34
34 -
 35
35 -
 36
36 -
 37
37 -
 38
38 -
 39
39 -
 40
40 -
 41
41 -
 42
42 -
 43
43 -
 44
44 -
 45
45 -
 46
46 -
47
-
48
-
49
-
50
-
51
-
52
-
53
-
54
-
55
-
56
-
57
-
58
-
59
-
60
-
61
-
62
-
63
-
64
-
65
-
66
-
67
-
68
-
69
-
70
-
71
-
72
-
73
-
74
-
75
-
76
-
77
-
78
-
79
-
80
-
81
-
82
-
83
-
84
-
85
-
86
-
87
-
88
-
89
-
90
-
91
-
92
-
93
-
94
-
95
-
96
-
97
-
98
-
99
-
100
-
101
-
102
-
103
-
104
-
105
-
106
-
107
-
108
-
109
-
110
-
111
-
112
-
113
-
114
-
115
-
116
-
117
-
118
-
119
-
120
 |
 |

Management’s Discussion
34
• Equipment sales revenue is reported primarily within our
Document Technology segment and the document outsourcing
business within our Services segment. Equipment sales revenue
decreased 10% and included a 2-percentage point negative impact
from currency, primarily driven by delayed customer decision-making
and overall weak economic and market conditions. An increase in
total product installs was offset by the impact of lower product mix
and price declines. Price declines were in the range of 5%-10%.
Equipment sales within our Services segment continued to grow,
driven by the migration of customers looking to reduce printing costs
by moving to our document outsourcing offering.
• Color2 revenue decreased 6%, including a 2-percentage point
negative impact from currency. An increase in color pages of 9%
and color MIF of 14% were offset by a decline in color equipment
sales revenue, driven primarily by weakness in Europe and the
impact of lower product mix. Color pages represented 30% of total
pages in 2012.
Revenue 2011
Total revenues increased 5% compared to the prior year. Our
consolidated 2011 results include a full year of revenues from ACS,
which was acquired on February 5, 2010. On a pro-forma1 basis,
including ACS’s estimated 2010 revenues for the period from January 1
through February 5 in our historical 2010 results, the total revenue for
2011 grew 2%. Total revenue growth included a 2-percentage point
positive impact from currency. Total revenues included the following:
• Annuity revenue increased 6% or 2% on a pro-forma1 basis, with a
1-percentage point positive impact from currency. Annuity revenue is
comprised of the following:
-Outsourcing, service and rentals revenue of $14,868 million
increased 8%, or 4% on a pro-forma1 basis, and included a
2-percentage point positive impact from currency. The increase
was primarily due to growth in BPO and DO revenue in our Services
segment partially offset by a decline in pages. Total digital pages
declined 3% despite a 2% increase in digital MIF.
-Supplies and other sales of $2,371 million decreased 2%, or 3% on
a pro-forma1 basis, with no impact from currency.
-Paper sales of $899 million decreased 6% and included a
2-percentage point negative impact from currency.
• Equipment sales revenue was flat and included a 1-percentage point
positive impact from currency. Favorable product mix in high-end
products was offset by price declines in the range of 5%-10%.
• Color2 revenue increased 5%, including a 2-percentage point
negative impact from currency. This increase was due to an increase
in color pages of 9% and an increase in color equipment sales
revenue of 4%. Color2 pages represented 27% of total pages in
2011 while color device MIF represented 35% of total MIF.
An analysis of the change in revenue for each business segment is
included in the “Operations Review of Segment Revenue and Profit”
section.
Costs, Expenses and Other Income
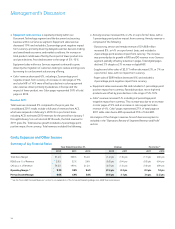
Summary of Key Financial Ratios
Year Ended December 31, Change Pro-forma (1)
2012 2011 2010 2012 2011 2011 2010
Total Gross Margin 31.4% 32.8% 34.4% (1.4) pts (1.6) pts (1.1) pts (0.2) pts
RD&E as a % of Revenue 2.9% 3.2% 3.6% (0.3) pts (0.4) pts (0.3) pts (0.4) pts
SAG as a % of Revenue 19.2% 19.9% 21.2% (0.7) pts (1.3) pts (1.0) pts (0.9) pts
Operating Margin (1) 9.3% 9.8% 9.6% (0.5) pts 0.2 pts 0.3 pts 1.0 pts
Pre-tax Income Margin 6.0% 6.9% 3.8% (0.9) pts 3.1 pts 3.4 pts (2.2) pts
(1) See the “Non-GAAP Financial Measures” section for an explanation of Pro-forma and Operating Margin non-GAAP financial measures.