Xerox 2012 Annual Report Download - page 41
Download and view the complete annual report
Please find page 41 of the 2012 Xerox annual report below. You can navigate through the pages in the report by either clicking on the pages listed below, or by using the keyword search tool below to find specific information within the annual report.-
 1
1 -
2
-
3
-
4
-
5
-
6
-
7
-
8
-
9
-
10
-
11
-
12
-
13
-
14
-
15
-
16
-
17
-
18
-
19
-
20
-
21
-
22
-
23
-
24
-
25
-
26
-
27
-
28
-
29
-
30
-
 31
31 -
 32
32 -
 33
33 -
 34
34 -
 35
35 -
 36
36 -
 37
37 -
 38
38 -
 39
39 -
 40
40 -
 41
41 -
 42
42 -
 43
43 -
 44
44 -
 45
45 -
 46
46 -
 47
47 -
 48
48 -
 49
49 -
 50
50 -
 51
51 -
52
-
53
-
54
-
55
-
56
-
57
-
58
-
59
-
60
-
61
-
62
-
63
-
64
-
65
-
66
-
67
-
68
-
69
-
70
-
71
-
72
-
73
-
74
-
75
-
76
-
77
-
78
-
79
-
80
-
81
-
82
-
83
-
84
-
85
-
86
-
87
-
88
-
89
-
90
-
91
-
92
-
93
-
94
-
95
-
96
-
97
-
98
-
99
-
100
-
101
-
102
-
103
-
104
-
105
-
106
-
107
-
108
-
109
-
110
-
111
-
112
-
113
-
114
-
115
-
116
-
117
-
118
-
119
-
120
 |
 |
39Xerox 2012 Annual Report
Recent Accounting Pronouncements
Refer to Note 1 – Summary of Significant Accounting Policies in
the Consolidated Financial Statements for a description of recent
accounting pronouncements including the respective dates of adoption
and the effects on results of operations and financial conditions.
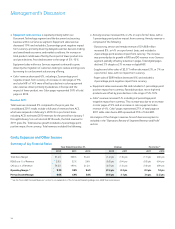
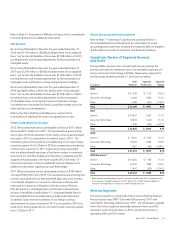
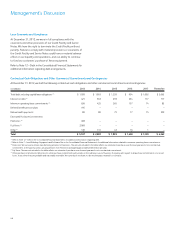
Operations Review of Segment Revenue
and Profit
Our reportable segments are consistent with how we manage the
business and view the markets we serve. Our reportable segments are
Services, Document Technology and Other. Revenues by segment for
the three years ended December 31, 2012 were as follows:
Total Segment Segment
(in millions) Revenue Profit (Loss) Margin
2012
Services $ 11,528 $ 1,173 10.2%
Document Technology 9,462 1,065 11.3%
Other 1,400 (241) (17.2)%
Total $ 22,390 $ 1,997 8.9%
2011
Services $ 10,837 1,207 11.1%
Document Technology 10,259 1,140 11.1%
Other 1,530 (255) (16.7)%
Total $ 22,626 $ 2,092 9.2%
2010
Services $ 9,637 $ 1,132 11.7%
Document Technology 10,349 1,085 10.5%
Other 1,647 (342) (20.8)%
Total $ 21,633 $ 1,875 8.7%
2010 Pro-forma(1)
Services $ 10,256 $ 1,166 11.4%
Document Technology 10,349 1,085 10.5%
Other 1,647 (353) (21.4)%
Total $ 22,252 $ 1,898 8.5%
(1) Results are discussed primarily on a pro-forma basis and include ACS’s estimated results
from January 1 through February 5 in 2010. See the “Non-GAAP Financial Measures”
section for an explanation of these non-GAAP financial measures.
Services Segment
Our Services segment is comprised of three service offerings: Business
Process Outsourcing (“BPO”), Document Outsourcing (“DO”) and
Information Technology Outsourcing (“ITO”). The DO business included
within the Services segment essentially represents Xerox’s pre-ACS
acquisition outsourcing business, as ACS’s outsourcing business is
reported as BPO and ITO revenue.
Refer to Note 8 – Investment in Affiliates, at Equity, in the Consolidated
Financial Statements for additional information.
Net Income
Net income attributable to Xerox for the year ended December 31,
2012 was $1,195 million, or $0.88 per diluted share. On an adjusted
basis1, net income attributable to Xerox was $1,398 million, or $1.03
per diluted share, and included adjustments for the amortization of
intangible assets.
Net income attributable to Xerox for the year ended December 31,
2011 was $1,295 million, or $0.90 per diluted share. On an adjusted
basis1, net income attributable to Xerox was $1,563 million, or $1.08
per diluted share, and included adjustments for the amortization of
intangible assets and the loss on early extinguishment of liability.
Net income attributable to Xerox for the year ended December 31,
2010 was $606 million, or $0.43 per diluted share. On an adjusted
basis1, net income attributable to Xerox was $1,296 million, or $0.94
per diluted share, and included adjustments for the amortization
of intangible assets, restructuring and asset impairment charges
(including those incurred by Fuji Xerox), acquisition-related costs and
other discrete costs and expenses.
Refer to the “Non-GAAP Financial Measures” section for the
reconciliation of reported net income to adjusted net income.
Other Comprehensive Income
2012 Other comprehensive loss attributable to Xerox of $511 million
decreased $217 million from 2011. The decreased loss was primarily
due to gains from the translation of our foreign currency-denominated
net assets in 2012 as compared to translation losses in 2011. The
translation gains are the result of a strengthening of our major foreign
currencies against the U.S. Dollar in 2012 as compared to a weakening
of those same currencies in 2011. A decrease in losses associated
with our defined benefit plans was offset by an increase in unrealized
losses from our cash flow hedges primarily due to a weakening of the
Japanese Yen particularly in the fourth quarter 2012 (See Note 13 –
Financial Instruments in the Consolidated Financial Statements for
additional information regarding our cash flow hedges).
2011 Other comprehensive loss attributable to Xerox of $728 million
increased $728 million from 2010. The increased loss was primarily due
to losses associated with our defined benefit plans due to an increase
in our benefit obligations as a result of a decrease in the discount
rates used to measure our obligations (See discussion of Pension
Plan Assumptions in the Application of Critical Accounting Policies
section of the MD&A as well as Note 15 – Employee Benefit Plans in
the Consolidated Financial Statements for additional information).
In addition, losses from the translation of our foreign currency-
denominated net assets increased in 2011 as compared to 2010 as a
result of the further weakening of our major foreign currencies against
the U.S. Dollar in 2011.