Xerox 2012 Annual Report Download - page 42
Download and view the complete annual report
Please find page 42 of the 2012 Xerox annual report below. You can navigate through the pages in the report by either clicking on the pages listed below, or by using the keyword search tool below to find specific information within the annual report.-
 1
1 -
2
-
3
-
4
-
5
-
6
-
7
-
8
-
9
-
10
-
11
-
12
-
13
-
14
-
15
-
16
-
17
-
18
-
19
-
20
-
21
-
22
-
23
-
24
-
25
-
26
-
27
-
28
-
29
-
30
-
31
-
 32
32 -
 33
33 -
 34
34 -
 35
35 -
 36
36 -
 37
37 -
 38
38 -
 39
39 -
 40
40 -
 41
41 -
 42
42 -
 43
43 -
 44
44 -
 45
45 -
 46
46 -
 47
47 -
 48
48 -
 49
49 -
 50
50 -
 51
51 -
 52
52 -
53
-
54
-
55
-
56
-
57
-
58
-
59
-
60
-
61
-
62
-
63
-
64
-
65
-
66
-
67
-
68
-
69
-
70
-
71
-
72
-
73
-
74
-
75
-
76
-
77
-
78
-
79
-
80
-
81
-
82
-
83
-
84
-
85
-
86
-
87
-
88
-
89
-
90
-
91
-
92
-
93
-
94
-
95
-
96
-
97
-
98
-
99
-
100
-
101
-
102
-
103
-
104
-
105
-
106
-
107
-
108
-
109
-
110
-
111
-
112
-
113
-
114
-
115
-
116
-
117
-
118
-
119
-
120
 |
 |

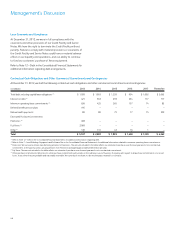
Management’s Discussion
40
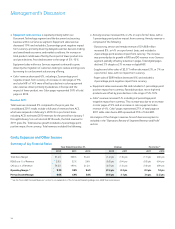
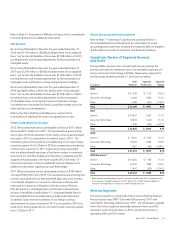
Services segment revenues for the three years ended December 31, 2012 were as follows:
Pro-forma(1)
Revenue Change Change
(in millions) 2012 2011 2010 2012 2011 2011
Business processing outsourcing $ 6,610 $ 6,074 $ 5,145 9% 18% 8%
Document outsourcing 3,659 3,545 3,264 3% 9% 9%
Information technology outsourcing 1,426 1,326 1,249 8% 6% (4)%
Less: Intra-segment elimination (167) (108) (21) * * *
Total Services Revenue $ 11,528 $ 10,837 $ 9,637 6% 12% 6%
* Percent not meaningful.
(1) See the “Non-GAAP Financial Measures” section for an explanation of this non-GAAP financial measure.
Note: In 2011, the Services segment is discussed on a pro-forma1 basis.
ACS was acquired on February 5, 2010, accordingly for comparison
purposes, we adjusted our historical 2010 results to include ACS’s 2010
estimated results for the period from January 1 through February 5,
2010. We believe these pro-forma comparisons provide a perspective
on the impact of the ACS acquisition on our results and trends. Refer to
the “Non-GAAP Financial Measures” section for a further explanation
and discussion of this non-GAAP presentation.
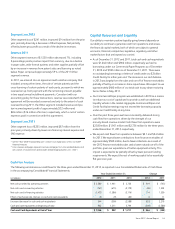
Revenue 2012
Services revenue of $11,528 million increased 6% with a 1-percentage
point negative impact from currency.
• BPO revenue increased 9%, including a 1-percentage point negative
impact from currency, and represented 57% of total Services
revenue. BPO growth was driven by the government healthcare,
healthcare payer, customer care, financial services, retail, travel and
insurance businesses and other state government solutions, as well
as the benefits from recent acquisitions.
• DO revenue increased 3%, including a 2-percentage point negative
impact from currency, and represented 31% of total Services
revenue. The increase in DO revenue was primarily driven by our new
partner print services offerings as well as new signings.
• ITO revenue increased 8% and represented 12% of total Services
revenue. ITO growth was driven by the revenue ramp resulting from
strong growth in recent quarters and also includes 3-percentage
points of growth related to revenue from intercompany services,
which is eliminated in total Services segment revenue.
Segment Margin 2012
Services segment margin of 10.2% decreased 0.9-percentage points
from the prior year primarily due to a decline in gross margin, which
was driven by the ramping of new services contracts, pressure on
government contracts, the impact of lower contract renewals and
lower volumes in some areas of the business. The gross margin decline
was partially offset by the benefits from restructuring and lower SAG,
primarily in DO.
Metrics
Pipeline
Our total services sales pipeline at December 31, 2012, including
synergy opportunities, grew 6% over the prior year. This sales pipeline
includes the Total Contract Value (“TCV”) of new business opportunities
that potentially could be contracted within the next six months and
excludes business opportunities with estimated annual recurring
revenue in excess of $100 million.
Signings
Signings are defined as estimated future revenues from contracts
signed during the period, including renewals of existing contracts.TCV
represents the estimated future contract revenue for pipeline or signed
contracts for signings, as applicable.
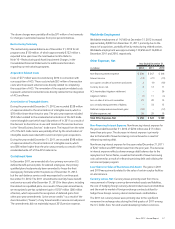
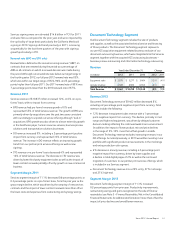
Signings were as follows:
Year Ended December 31,
(in billions) 2012 2011 2010
BPO $ 6.0 $ 6.8 $ 10.0
DO 3.3 4.4 3.3
ITO 1.5 3.4 1.3
Total Signings $ 10.8 $ 14.6 $ 14.6
Services signings were an estimated $10.8 billion in TCV for 2012 and
decreased 25% compared to the prior year. This decline was driven
by a decrease in large deals from the prior year as well as delays
in customer decision making. While the total number of BPO/ITO
contracts signed in 2012 increased from 2011, the decline in large
deals drove a reduction in the average contract length of new business
signings in 2012. The above DO signings amount represents Enterprise
signings only and does not include signings from our partner print
services offerings, which is driving the revenue growth in DO.