Xerox 2012 Annual Report Download - page 43
Download and view the complete annual report
Please find page 43 of the 2012 Xerox annual report below. You can navigate through the pages in the report by either clicking on the pages listed below, or by using the keyword search tool below to find specific information within the annual report.-
 1
1 -
2
-
3
-
4
-
5
-
6
-
7
-
8
-
9
-
10
-
11
-
12
-
13
-
14
-
15
-
16
-
17
-
18
-
19
-
20
-
21
-
22
-
23
-
24
-
25
-
26
-
27
-
28
-
29
-
30
-
31
-
32
-
 33
33 -
 34
34 -
 35
35 -
 36
36 -
 37
37 -
 38
38 -
 39
39 -
 40
40 -
 41
41 -
 42
42 -
 43
43 -
 44
44 -
 45
45 -
 46
46 -
 47
47 -
 48
48 -
 49
49 -
 50
50 -
 51
51 -
 52
52 -
 53
53 -
54
-
55
-
56
-
57
-
58
-
59
-
60
-
61
-
62
-
63
-
64
-
65
-
66
-
67
-
68
-
69
-
70
-
71
-
72
-
73
-
74
-
75
-
76
-
77
-
78
-
79
-
80
-
81
-
82
-
83
-
84
-
85
-
86
-
87
-
88
-
89
-
90
-
91
-
92
-
93
-
94
-
95
-
96
-
97
-
98
-
99
-
100
-
101
-
102
-
103
-
104
-
105
-
106
-
107
-
108
-
109
-
110
-
111
-
112
-
113
-
114
-
115
-
116
-
117
-
118
-
119
-
120
 |
 |

41Xerox 2012 Annual Report
Services signings were an estimated $14.6 billion in TCV for 2011
and were flat as compared to the prior year and were impacted by
the cyclicality of large deals particularly the California Medicaid
signing in 2010. Signings did trend positively in 2011, increasing
sequentially for the last three quarters of the year with signings
growth particularly in ITO.
Renewal rate (BPO and ITO only)
Renewal rate is defined as the annual recurring revenue (“ARR”) on
contracts that are renewed during the period as a percentage of
ARR on all contracts on which a renewal decision was made during
the period. Although our renewal rate was below our target range in
the fourth quarter 2012, our full year 2012 renewal rate was 85%,
which was within our target range of 85%-90% and 5-percentage
points higher than full year 2011. Our 2011 renewal rate of 80% was
7-percentage points lower than the 2010 renewal rate of 87%.
Revenue 2011
Services revenue of $10,837 million increased 12%, or 6% on a pro-
forma1 basis, with no impact from currency.
• BPO revenue had pro-forma1 revenue growth of 8% and
represented 55% of total Services revenue. The growth in BPO was
primarily driven by acquisitions over the past two years consistent
with our strategy to expand our service offerings through “tuck-in”
acquisitions. BPO growth was also driven to a lesser extent by growth
in the healthcare payer, human resources services, business process
solutions and transportation solutions businesses.
• DO revenue increased 9%, including a 2-percentage point positive
impact from currency, and represented 33% of total Services
revenue. The increase in DO revenue reflects an improving growth
trend from our partner print services offerings as well as new
signings.
• ITO revenue on a pro-forma1 basis decreased 4% and represented
12% of total Services revenue. The decrease in ITO revenue was
driven by lower third-party equipment sales as well as the impact of
lower contract renewals partially offset by growth in new commercial
business.
Segment Margin 2011
Services segment margin of 11.1% decreased 0.6-percentage points, or
0.3-percentage points on a pro-forma1 basis, from the prior year as the
gross margin decline, which was driven by the ramping of new services
contracts and the impact of lower contract renewals more than offset
the lower costs and expenses from restructuring and synergy savings.
Document Technology Segment
Our Document Technology segment includes the sale of products
and supplies, as well as the associated technical service and financing
of those products. The Document Technology segment represents
our pre-ACS acquisition equipment-related business exclusive of our
document outsourcing business, which was integrated into the Services
segment together with the acquired ACS outsourcing businesses –
business process outsourcing and information technology outsourcing.
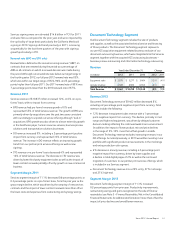
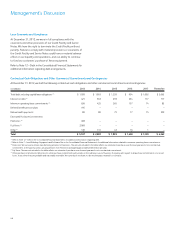
Revenue
Year Ended December 31, Change
(in millions) 2012 2011 2010 2012 2011
Equipment sales $ 2,879 $ 3,277 $ 3,404 (12)% (4)%
Annuity revenue 6,583 6,982 6,945 (6)% 1%
Total Revenue $ 9,462 $ 10,259 $ 10,349 (8)% (1)%
Revenue 2012
Document Technology revenue of $9,462 million decreased 8%,
including a 2-percentage point negative impact from currency. Total
revenues include the following:
• 12% decrease in equipment sales revenue with a 1-percentage
point negative impact from currency. This decline, primarily in mid-
range and high-end equipment, was driven by delayed customer
decision-making reflecting the continued weak macro-environment.
In addition, the impact of lower product mix and price declines
in the range of 5%-10% more than offset growth in installs.
Document Technology revenue excludes increasing revenues in our
DO offerings. As noted previously, in 2013 we will be investing in our
portfolio with significant product announcements in the mid-range
and entry production color spaces.
• 6% decrease in annuity revenue, including a 2-percentage point
negative impact from currency, driven by lower supplies and
a decline in total digital pages of 2% as well as the continued
migration of customers to our partner print services offerings, which
is included in our Services segment.
• Document Technology revenue mix is 22% entry, 57% mid-range
and 21% high-end.
Segment Margin 2012
Document Technology segment margin of 11.3% increased
0.2-percentage points from prior year. Productivity improvements,
restructuring savings and gains recognized on the sale of finance
receivables (see Note 5 – Finance Receivables, Net in the Consolidated
Financial Statements for additional information) more than offset the
impact of price declines and overall lower revenues.