Xerox 2012 Annual Report Download - page 35
Download and view the complete annual report
Please find page 35 of the 2012 Xerox annual report below. You can navigate through the pages in the report by either clicking on the pages listed below, or by using the keyword search tool below to find specific information within the annual report.-
 1
1 -
2
-
3
-
4
-
5
-
6
-
7
-
8
-
9
-
10
-
11
-
12
-
13
-
14
-
15
-
16
-
17
-
18
-
19
-
20
-
21
-
22
-
23
-
24
-
 25
25 -
 26
26 -
 27
27 -
 28
28 -
 29
29 -
 30
30 -
 31
31 -
 32
32 -
 33
33 -
 34
34 -
 35
35 -
 36
36 -
 37
37 -
 38
38 -
 39
39 -
 40
40 -
 41
41 -
 42
42 -
 43
43 -
 44
44 -
 45
45 -
46
-
47
-
48
-
49
-
50
-
51
-
52
-
53
-
54
-
55
-
56
-
57
-
58
-
59
-
60
-
61
-
62
-
63
-
64
-
65
-
66
-
67
-
68
-
69
-
70
-
71
-
72
-
73
-
74
-
75
-
76
-
77
-
78
-
79
-
80
-
81
-
82
-
83
-
84
-
85
-
86
-
87
-
88
-
89
-
90
-
91
-
92
-
93
-
94
-
95
-
96
-
97
-
98
-
99
-
100
-
101
-
102
-
103
-
104
-
105
-
106
-
107
-
108
-
109
-
110
-
111
-
112
-
113
-
114
-
115
-
116
-
117
-
118
-
119
-
120
 |
 |

33Xerox 2012 Annual Report
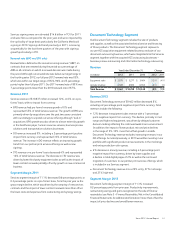
We will to continue to monitor the impact of economic, market and industry factors impacting these reporting units in 2013. Subsequent to our
fourth quarter impairment test, we did not identify any indicators of potential impairment that required an update to the annual impairment test.
Refer to Note 9 – Goodwill and Intangible Assets, Net in the Consolidated Financial Statements for additional information regarding goodwill by
reportable segment.
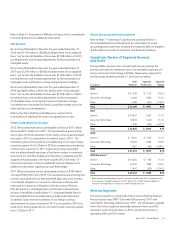
Revenue Results Summary
Total Revenue
Revenue for the three years ended December 31, 2012 was as follows:
Revenues Change Pro-forma (1) Percent of Total Revenue
(in millions) 2012 2011 2010 2012 2011 2011 2012 2011 2010
Equipment sales $ 3,476 $ 3,856 $ 3,857 (10)% – – 16% 17% 18%
Annuity revenue 18,914 18,770 17,776 1% 6% 2% 84% 83% 82%
Total Revenue $ 22,390 $ 22,626 $ 21,633 (1)% 5% 2% 100% 100% 100%
Reconciliation to Consolidated Statements of Income:
Sales $ 6,578 $ 7,126 $ 7,234
Less: Supplies and other sales (2,273) (2,371) (2,420)
Less: Paper sales (829) (899) (957)
Equipment Sales $ 3,476 $ 3,856 $ 3,857 (10)% – – 16% 17% 18%
Outsourcing, service and rentals $ 15,215 $ 14,868 $ 13,739 2% 8% 4% 68% 66% 64%
Add: Finance income 597 632 660 (6)% (4)% (4)% 2% 3% 3%
Add: Supplies and other sales 2,273 2,371 2,420 (4)% (2)% (3)% 10% 10% 11%
Add: Paper sales 829 899 957 (8)% (6)% (6)% 4% 4% 4%
Annuity Revenue $ 18,914 $ 18,770 $ 17,776 1% 6% 2% 84% 83% 82%
(1) 2011 Results are discussed primarily on a pro-forma basis and include ACS’s estimated results from January 1 through February 5 in 2010. See the “Non-GAAP Financial Measures” section
for an explanation of this non-GAAP financial measure.
Revenue 2012
Total revenues decreased 1% compared to the prior year and included
a 1-percentage point negative impact from currency. Total revenues
included the following:
• Annuity revenue increased 1% and included a 1-percentage point
negative impact from currency. Annuity revenue is comprised of the
following:
-Outsourcing, service and rentals revenue – includes outsourcing
revenue within our Services segment and technical service revenue
(including bundled supplies) and rental revenue, both primarily
within our Document Technology segment. Revenues of
$15,215 million increased 2% and included a 2-percentage point
negative impact from currency. The increase was primarily driven
by growth in all three lines of business in our Services segment,
partially offset by a decline in technical service revenues. Total
digital pages declined 2% despite a 3% increase in digital MIF.
-Supplies and other sales – includes unbundled supplies and
other sales, primarily within our Document Technology segment.
Revenues of $2,273 million decreased 4% and included a
1-percentage negative impact from currency. The decrease was
primarily due to moderately lower demand.
-Paper sales – which are primarily included within our Other
segment, of $829 million decreased 8% and included a
2-percentage point negative impact from currency, driven primarily
by market pricing and lower activity.
-Finance income – includes $44 million in gains from the sale of
finance receivables from our Document Technology segment (see
Note 5 – Finance Receivables, Net in the Consolidated Financial
Statements for additional information).