Xcel Energy 2002 Annual Report Download - page 86
Download and view the complete annual report
Please find page 86 of the 2002 Xcel Energy annual report below. You can navigate through the pages in the report by either clicking on the pages listed below, or by using the keyword search tool below to find specific information within the annual report.-
 1
1 -
2
-
3
-
4
-
5
-
6
-
7
-
8
-
9
-
10
-
11
-
12
-
13
-
14
-
15
-
16
-
17
-
18
-
19
-
20
-
21
-
22
-
23
-
24
-
25
-
26
-
27
-
28
-
29
-
30
-
31
-
32
-
33
-
34
-
35
-
36
-
37
-
38
-
39
-
40
-
41
-
42
-
43
-
44
-
45
-
46
-
47
-
48
-
49
-
50
-
51
-
52
-
53
-
54
-
55
-
56
-
57
-
58
-
59
-
60
-
61
-
62
-
63
-
64
-
65
-
66
-
67
-
68
-
69
-
70
-
71
-
72
-
73
-
74
-
75
-
 76
76 -
 77
77 -
 78
78 -
 79
79 -
 80
80 -
 81
81 -
 82
82 -
 83
83 -
 84
84 -
 85
85 -
 86
86 -
 87
87 -
 88
88 -
 89
89 -
 90
90
 |
 |

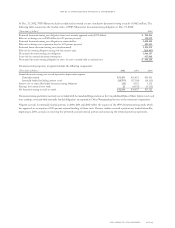
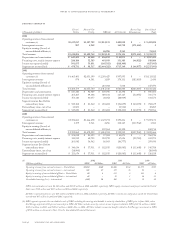
Quarter Ended
March 31, 2001 June 30, 2001 Sept. 30, 2001 Dec. 31, 2001
(Thousands of dollars, except per share amounts) (b) (b)
Revenue(c) $3,174,066 $2,743,822 $2,931,799 $2,483,735
Operating income 461,097 416,843 635,884 344,323
Income from continuing operations before extraordinary items 191,974 162,654 264,823 118,236
Discontinued operations – income (loss) 17,336 5,203 8,080 16,373
Extraordinary items – income – – – 10,287
Net income 209,310 167,857 272,903 144,896
Earnings available for common shareholders 208,250 166,797 271,843 143,835
Earnings per share from continuing operations
before extraordinary items – basic and diluted $ 0.56 $ 0.47 $ 0.77 $ 0.34
Earnings per share discontinued operations – basic and diluted $ 0.05 $ 0.02 $ 0.02 $ 0.05
Earnings per share extraordinary items – basic and diluted $ – $ – $ – $ 0.03
Earnings per share – basic and diluted $ 0.61 $ 0.49 $ 0.79 $ 0.42
(a) 2002 results include special charges and unusual items in all quarters, as discussed in Note 2 to the Consolidated Financial Statements.
– First-quarter results were decreased by $9 million, or 1 cent per share, for a special charge related to utility/service company employee restaffing costs, and by
$5 million, or 1 cent per share, for regulatory recovery adjustments at SPS.
– Second-quarter results were decreased by $36 million, or 9 cents per share, for NEO-related special charges taken by NRG.
– Third-quarter results (as restated) were decreased by $2.5 billion, or $5.97 per share, for special charges related to NRG asset impairments and financial
restructuring, and were increased by $676 million, or $1.77 per share, due to estimated tax benefits related to Xcel Energy’s investment in NRG.
– Fourth-quarter results were decreased by $100 million, or 24 cents per share, for special charges related to NRG asset impairments and financial restructuring
costs, and increased by $30 million, or $0.08 per share, due to revisions to the estimated tax benefits related to Xcel Energy’s investment in NRG.
(b) 2001 results include special charges and unusual items in the second and fourth quarters, as discussed in Note 2 to the Consolidated Financial Statements.
– Second-quarter results were increased by $41 million, or 7 cents per share, for conservation incentive adjustments, and decreased by $23 million, or 4 cents
per share, for a special charge related to postemployment benefits.
– Fourth-quarter results were decreased by $39 million, or 7 cents per share, for a special charge related to employee restaffing costs.
(c) Certain items in the 2001 and 2002 quarterly income statements have been reclassified to conform to the 2002 annual presentation. These reclassifications
included the netting of trading revenues and expenses previously reported gross, and NRG’s discontinued operations, as discussed in Notes 1 and 3 to the
Consolidated Financial Statements, respectively.
(d) Third-quarter 2002 results for NRG have been restated from amounts previously reported. NRG’s asset impairments and restructuring charges for the quarter have
been restated, increasing NRG’s operating expenses by $192 million and a correction for interest rate swaps that resulted in additional income of $62 million,
for a net effect of $130 million in additional loss for the quarter. As a result, Xcel Energy’s Special Charges included in operating expenses for the quarter ended
Sept. 30, 2002, increased by $192 million, or $0.50 per share.
page 100 xcel energy inc. and subsidiaries
notes to consolidated financial statements