Xcel Energy 2002 Annual Report Download - page 33
Download and view the complete annual report
Please find page 33 of the 2002 Xcel Energy annual report below. You can navigate through the pages in the report by either clicking on the pages listed below, or by using the keyword search tool below to find specific information within the annual report.-
 1
1 -
2
-
3
-
4
-
5
-
6
-
7
-
8
-
9
-
10
-
11
-
12
-
13
-
14
-
15
-
16
-
17
-
18
-
19
-
20
-
21
-
22
-
 23
23 -
 24
24 -
 25
25 -
 26
26 -
 27
27 -
 28
28 -
 29
29 -
 30
30 -
 31
31 -
 32
32 -
 33
33 -
 34
34 -
 35
35 -
 36
36 -
 37
37 -
 38
38 -
 39
39 -
 40
40 -
 41
41 -
 42
42 -
 43
43 -
44
-
45
-
46
-
47
-
48
-
49
-
50
-
51
-
52
-
53
-
54
-
55
-
56
-
57
-
58
-
59
-
60
-
61
-
62
-
63
-
64
-
65
-
66
-
67
-
68
-
69
-
70
-
71
-
72
-
73
-
74
-
75
-
76
-
77
-
78
-
79
-
80
-
81
-
82
-
83
-
84
-
85
-
86
-
87
-
88
-
89
-
90
 |
 |

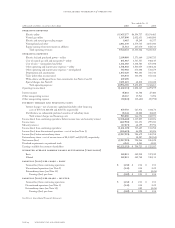
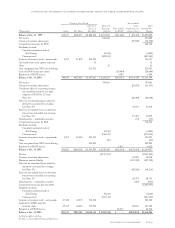
Common Stock Issued Accumulated
Capital in Retained Other Total
Excess of Earnings Shares Held Comprehensive Stockholders’
(Thousands) Shares Par Value Par Value (Deficit) by ESOP Income (Loss) Equity
Balance at Dec. 31, 1999 335,277 $838,193 $ 2,288,254 $ 2,253,800 $(11,606) $ (78,421) $ 5,290,220
Net income 526,828 526,828
Currency translation adjustments (78,508) (78,508)
Comprehensive income for 2000 448,320
Dividends declared:
Cumulative preferred stock of
Xcel Energy (4,241) (4,241)
Common stock (492,183) (492,183)
Issuances of common stock – net proceeds 5,557 13,892 102,785 116,677
Tax benefit from stock options exercised 53 53
Other 16 16
Gain recognized from NRG stock offering 215,933 215,933
Loan to ESOP to purchase shares (20,000) (20,000)
Repayment of ESOP loan(a) 6,989 6,989
Balance at Dec. 31, 2000 340,834 $852,085 $ 2,607,025 $ 2,284,220 $(24,617) $(156,929) $ 5,561,784
Net income 794,966 794,966
Currency translation adjustments (56,693) (56,693)
Cumulative effect of accounting change –
net unrealized transition loss upon
adoption of SFAS No. 133 (see
Note 17) (28,780) (28,780)
After-tax net unrealized gains related to
derivatives accounted for as hedges
(see Note 17) 43,574 43,574
After-tax net realized losses on derivative
transactions reclassified into earnings
(see Note 17) 19,449 19,449
Unrealized loss – marketable securities (75) (75)
Comprehensive income for 2001 772,441
Dividends declared:
Cumulative preferred stock of
Xcel Energy (4,241) (4,241)
Common stock (516,515) (516,515)
Issuances of common stock – net proceeds 4,967 12,418 120,673 133,091
Other (27) (27)
Gain recognized from NRG stock offering 241,891 241,891
Repayment of ESOP loan(a) 6,053 6,053
Balance at Dec. 31, 2001 345,801 $864,503 $ 2,969,589 $ 2,558,403 $(18,564) $(179,454) $ 6,194,477
Net loss (2,217,991) (2,217,991)
Currency translation adjustments 30,008 30,008
Minimum pension liability (107,782) (107,782)
After-tax net unrealized losses related to
derivatives accounted for as hedges
(see Note 17) (68,266) (68,266)
After-tax net realized losses on derivative
transactions reclassified into earnings
(see Note 17) 28,791 28,791
Unrealized loss – marketable securities (457) (457)
Comprehensive income (loss) for 2002 (2,335,697)
Dividends declared:
Cumulative preferred stock of
Xcel Energy (4,241) (4,241)
Common stock (437,113) (437,113)
Issuances of common stock – net proceeds 27,148 67,870 513,342 581,212
Acquisition of NRG minority
common shares 25,765 64,412 555,220 28,150 647,782
Repayment of ESOP loan(a) 18,564 18,564
Balance at Dec. 31, 2002 398,714 $996,785 $4,038,151 $ (100,942) $ – $(269,010) $4,664,984
(a) Did not affect cash flows.
See Notes to Consolidated Financial Statements
consolidated statements of common stockholders’equity and other comprehensive income
xcel energy inc. and subsidiaries page 47