Xcel Energy 2002 Annual Report Download - page 20
Download and view the complete annual report
Please find page 20 of the 2002 Xcel Energy annual report below. You can navigate through the pages in the report by either clicking on the pages listed below, or by using the keyword search tool below to find specific information within the annual report.-
 1
1 -
2
-
3
-
4
-
5
-
6
-
7
-
8
-
9
-
 10
10 -
 11
11 -
 12
12 -
 13
13 -
 14
14 -
 15
15 -
 16
16 -
 17
17 -
 18
18 -
 19
19 -
 20
20 -
 21
21 -
 22
22 -
 23
23 -
 24
24 -
 25
25 -
 26
26 -
 27
27 -
 28
28 -
 29
29 -
 30
30 -
31
-
32
-
33
-
34
-
35
-
36
-
37
-
38
-
39
-
40
-
41
-
42
-
43
-
44
-
45
-
46
-
47
-
48
-
49
-
50
-
51
-
52
-
53
-
54
-
55
-
56
-
57
-
58
-
59
-
60
-
61
-
62
-
63
-
64
-
65
-
66
-
67
-
68
-
69
-
70
-
71
-
72
-
73
-
74
-
75
-
76
-
77
-
78
-
79
-
80
-
81
-
82
-
83
-
84
-
85
-
86
-
87
-
88
-
89
-
90
 |
 |

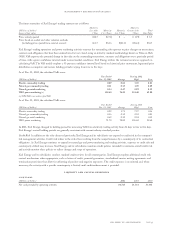
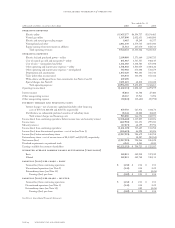
Cash provided by operating activities increased during 2002, compared with 2001, primarily due to NRG’s efforts to conserve cash
by deferring the payment of interest payments and managing its cash flows more closely. NRG’s accrued interest costs rose by nearly
$200 million in 2002, compared with year-end 2001 levels. In addition, regulated utility operating cash flows increased in 2002 due
to lower 2002 receivables and unbilled revenues, reflecting collections of higher year-end 2001 amounts. Cash provided by operating
activities increased during 2001, compared with 2000, primarily due to higher net income, depreciation and improved working capital.
(Millions of dollars) 2002 2001 2000
Net cash used in investing activities $(2,718) $(5,168) $(3,347)
Cash used in investing activities decreased during 2002, compared with 2001, primarily due to lower levels of nonregulated capital
expenditures as a result of NRG terminating its acquisition program due to its financial difficulties. Such nonregulated expenditures
decreased $2.8 billion in 2002 due mainly to NRG asset acquisitions in 2001 that did not recur in 2002. Cash used in investing activities
increased during 2001, compared with 2000, primarily due to increased levels of nonregulated capital expenditures and asset acquisitions,
primarily at NRG. The increase was partially offset by Xcel Energy’s sale of most of its investment in Yorkshire Power.
(Millions of dollars) 2002 2001 2000
Net cash provided by financing activities $ 1,580 $ 3,713 $ 2,016
Cash provided by financing activities decreased during 2002, compared with 2001, primarily due to lower NRG capital requirements
and constraints on NRG’s ability to access the capital market due to its financial difficulties, as discussed previously. NRG’s cash provided
from financing activities declined by $2.7 billion in 2002, compared with 2001. Cash provided by financing activities increased during
2001, compared with 2000, primarily due to increased short-term borrowings and net long-term debt issuances, mainly to fund
NRG acquisitions.
See discussion of trends, commitments and uncertainties with the potential for future impact on cash flow and liquidity under Capital Sources.
capital requirements
Utility Capital Expenditures, Nonregulated Investments and Long-Term Debt Obligations The estimated cost of the capital expenditure
programs of Xcel Energy and its subsidiaries, excluding NRG, and other capital requirements for the years 2003, 2004 and 2005 are
shown in the table below.
(Millions of dollars) 2003 2004 2005
Electric utility $ 700 $ 840 $ 950
Natural gas utility 110 110 110
Common utility 90 50 40
Total utility 900 1,000 1,100
Other nonregulated (excluding NRG) 32 23 15
Total capital expenditures 932 1,023 1,115
Sinking funds and debt maturities 563 169 223
Total capital requirements $ 1,495 $ 1,192 $ 1,338
The capital expenditure forecast for 2004 includes new steam generators at the Prairie Island nuclear plant. These expenditures will not
occur unless the Minnesota Legislature grants additional spent fuel storage at Prairie Island during 2003. The capital expenditure forecast
also includes the early stages of the costs related to modifications to reduce the emissions of NSP-Minnesota’s generating plants located
in the Minneapolis and St. Paul metropolitan area. This project is expected to cost approximately $1.1 billion with major construction
starting in 2005 and finishing in 2009.
The capital expenditure programs of Xcel Energy are subject to continuing review and modification. Actual utility construction expenditures
may vary from the estimates due to changes in electric and natural gas projected load growth, the desired reserve margin and the availability
of purchased power, as well as alternative plans for meeting Xcel Energy’s long-term energy needs. In addition, Xcel Energy’s ongoing
evaluation of merger, acquisition and divestiture opportunities to support corporate strategies, address restructuring requirements and
comply with future requirements to install emission-control equipment may impact actual capital requirements. For more information,
see Notes 4 and 18 to the Consolidated Financial Statements.
Xcel Energy’s investment in exempt wholesale generators and foreign utility companies, which includes NRG and other Xcel Energy
subsidiaries, is currently limited to 100 percent of consolidated retained earnings, as a result of the PUHCA restrictions. At Dec.31, 2002,
such investments exceeded consolidated retained earnings.
NRG Energy is required to provide financial guarantees of up to approximately $8 million for closure and ongoing monitoring costs
of some sites to which it sends coal ash and other waste, by April 30, 2003.
page 34 xcel energy inc. and subsidiaries
management’s discussion and analysis