Xcel Energy 2002 Annual Report Download - page 57
Download and view the complete annual report
Please find page 57 of the 2002 Xcel Energy annual report below. You can navigate through the pages in the report by either clicking on the pages listed below, or by using the keyword search tool below to find specific information within the annual report.-
 1
1 -
2
-
3
-
4
-
5
-
6
-
7
-
8
-
9
-
10
-
11
-
12
-
13
-
14
-
15
-
16
-
17
-
18
-
19
-
20
-
21
-
22
-
23
-
24
-
25
-
26
-
27
-
28
-
29
-
30
-
31
-
32
-
33
-
34
-
35
-
36
-
37
-
38
-
39
-
40
-
41
-
42
-
43
-
44
-
45
-
46
-
 47
47 -
 48
48 -
 49
49 -
 50
50 -
 51
51 -
 52
52 -
 53
53 -
 54
54 -
 55
55 -
 56
56 -
 57
57 -
 58
58 -
 59
59 -
 60
60 -
 61
61 -
 62
62 -
 63
63 -
 64
64 -
 65
65 -
 66
66 -
 67
67 -
68
-
69
-
70
-
71
-
72
-
73
-
74
-
75
-
76
-
77
-
78
-
79
-
80
-
81
-
82
-
83
-
84
-
85
-
86
-
87
-
88
-
89
-
90
 |
 |

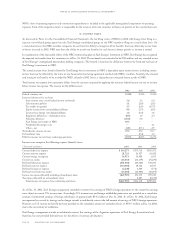
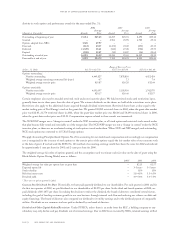
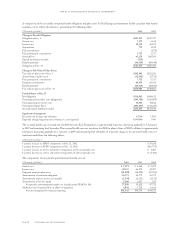
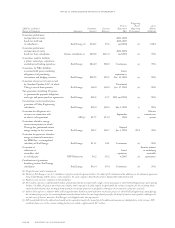
The components of Xcel Energy’s net deferred tax liability (current and noncurrent portions) at Dec. 31 were:
(Thousands of dollars) 2002 2001
Deferred tax liabilities
Differences between book and tax basis of property $2,060,450 $2,083,965
Regulatory assets 159,942 155,587
Partnership income/loss 33,739 53,955
Unrealized gains and losses on mark-to-market transactions –9,348
Tax benefit transfer leases 10,993 14,765
Employee benefits and other accrued liabilities 8,883 16,559
Other 78,250 66,538
Total deferred tax liabilities $2,352,257 $2,400,717
Deferred tax assets
Xcel Energy benefit on NRG $ 706,000 $–
Book write-down (impairment of assets) 707,183 –
Net operating loss carryforward 473,220 3,867
Differences between book and tax basis of contracts 19,806 82,972
Deferred investment tax credits 66,801 72,345
Regulatory liabilities 48,558 66,507
Unrealized gains and losses on mark-to-market transactions 30,707 –
Foreign tax loss carryforwards 16,088 90,251
Other 73,838 83,484
Total deferred tax assets $2,142,201 $ 399,426
Less valuation allowance 1,077,047 66,622
Net deferred tax liability $1,287,103 $2,067,913
12. common stock and incentive stock plans
Common Stock and Equivalents In February 2002, Xcel Energy issued 23 million shares of common stock at $22.50 per share. In June
2002, Xcel Energy issued 25.7 million shares of common stock to complete its exchange offer for the publicly held stock of NRG. As
a result of these issuances, Xcel Energy had approximately 399 million shares outstanding on Dec. 31, 2002.
In November 2002, Xcel Energy issued $230 million of 7.5-percent convertible senior notes. The senior notes are convertible into shares
of Xcel Energy common stock at a conversion price of $12.33 per share. The conversion of $230 million in notes at a share price of
$12.33 would be the equivalent of approximately 18.7 million shares. However, due to losses experienced in 2002, the impact of the
convertible senior notes was antidilutive and, therefore, was not included in the common stock and equivalent calculation in 2002.
Other common stock equivalents included stock options, as discussed further, and NRG equity units. See discussion of NRG equity
units, which are convertible to Xcel Energy common stock, at Note 7. Due to the losses experienced in 2002, these equivalents were
also antidilutive and were not incorporated in the common stock and equivalents calculation in 2002.
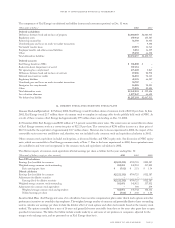
The dilutive impacts of common stock equivalents affected earnings per share as follows for the years ending Dec. 31:
(Thousands of dollars, except per share amounts) 2002 2001 2000
Basic EPS calculation
Earnings (loss) available for common $(2,222,232) $790,725 $522,587
Weighted average common stock outstanding 382,051 342,952 337,832
Basic earnings per share $(5.82) $ 2.31 $ 1.54
Diluted calculation
Earnings (loss) available for common $(2,222,232) $790,725 $522,587
Adjustments for dilutive securities –––
Earnings (loss) for dilutive securities $(2,222,232) $790,725 $522,587
Weighted average common stock outstanding 382,051 342,952 337,832
Adjustments for common stock equivalents –790 279
Weighted average common stock and equivalents 382,051 343,742 338,111
Diluted earnings per share $(5.82) $ 2.30 $ 1.54
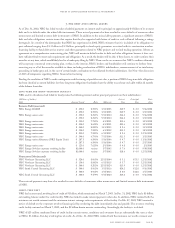
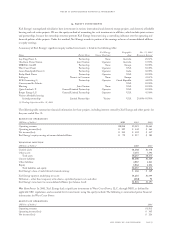
Incentive Stock Plans Xcel Energy and some of its subsidiaries have incentive compensation plans under which stock options and other
performance incentives are awarded to key employees. The weighted average number of common and potentially dilutive shares outstanding
used to calculate our earnings per share include the dilutive effect of stock options and other stock awards based on the treasury stock
method. The options normally have a term of 10 years and generally become exercisable from three to five years after grant date or upon
specified circumstances. The tables that follow include awards made by us and some of our predecessor companies, adjusted for the
merger stock exchange ratio, and are presented on an Xcel Energy share basis.
notes to consolidated financial statements
xcel energy inc. and subsidiaries page 71