Xcel Energy 2002 Annual Report Download - page 19
Download and view the complete annual report
Please find page 19 of the 2002 Xcel Energy annual report below. You can navigate through the pages in the report by either clicking on the pages listed below, or by using the keyword search tool below to find specific information within the annual report.-
 1
1 -
2
-
3
-
4
-
5
-
6
-
7
-
8
-
 9
9 -
 10
10 -
 11
11 -
 12
12 -
 13
13 -
 14
14 -
 15
15 -
 16
16 -
 17
17 -
 18
18 -
 19
19 -
 20
20 -
 21
21 -
 22
22 -
 23
23 -
 24
24 -
 25
25 -
 26
26 -
 27
27 -
 28
28 -
 29
29 -
30
-
31
-
32
-
33
-
34
-
35
-
36
-
37
-
38
-
39
-
40
-
41
-
42
-
43
-
44
-
45
-
46
-
47
-
48
-
49
-
50
-
51
-
52
-
53
-
54
-
55
-
56
-
57
-
58
-
59
-
60
-
61
-
62
-
63
-
64
-
65
-
66
-
67
-
68
-
69
-
70
-
71
-
72
-
73
-
74
-
75
-
76
-
77
-
78
-
79
-
80
-
81
-
82
-
83
-
84
-
85
-
86
-
87
-
88
-
89
-
90
 |
 |

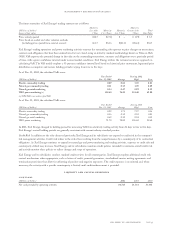
The future maturities of Xcel Energy’s trading contracts are as follows:
Maturity Maturity
(Millions of dollars) Less than Maturity Maturity Greater than Total
Source of fair value 1 Year 1 to 3 Years 4 to 5 Years 5 Years Fair Value
Prices actively quoted $12.7 $ (7.1) $ – $ (1.9) $ 3.7
Prices based on models and other valuation methods
(including prices quoted from external sources) $61.7 $52.6 $(23.0) $(56.6) $34.7
Xcel Energy’s trading operations and power marketing activities measure the outstanding risk exposure to price changes on transactions,
contracts and obligations that have been entered into, but not closed, using an industry standard methodology known as Value-at-Risk
(VaR). VaR expresses the potential change in fair value on the outstanding transactions, contracts and obligations over a particular period
of time, with a given confidence interval under normal market conditions. Xcel Energy utilizes the variance/covariance approach in
calculating VaR. The VaR model employs a 95-percent confidence interval level based on historical price movement, lognormal price
distribution assumption and various holding periods varying from two to five days.
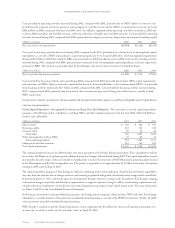
As of Dec. 31, 2002, the calculated VaRs were:
Year Ended During 2002
(Millions of dollars) Dec. 31, 2002 Average High Low
Electric commodity trading 0.29 0.62 3.39 0.01
Natural gas commodity trading 0.11 0.35 1.09 0.09
Natural gas retail marketing 0.54 0.47 0.92 0.32
NRG power marketing (a) 118.60 76.20 124.40 42.00
(a) NRG VaR is an undiversified VaR.
As of Dec. 31, 2001, the calculated VaRs were:
Year Ended During 2001
(Millions of dollars) Dec. 31, 2001 Average High Low
Electric commodity trading 0.52 1.71 7.37 0.16
Natural gas commodity trading 0.16 0.15 0.52 0.01
Natural gas retail marketing 0.69 0.39 0.94 0.13
NRG power marketing 71.70 78.80 126.60 58.60
In 2001, Xcel Energy changed its holding period for measuring VaR from electricity trading activity from 21 days to two to five days.
Xcel Energy’s revised holding periods are generally consistent with current industry standard practice.
Credit Risk In addition to the risks discussed previously, Xcel Energy and its subsidiaries are exposed to credit risk in the company’s
risk management activities. Credit risk relates to the risk of loss resulting from the nonperformance by a counterparty of its contractual
obligations. As Xcel Energy continues to expand its natural gas and power marketing and trading activities, exposure to credit risk and
counterparty default may increase. Xcel Energy and its subsidiaries maintain credit policies intended to minimize overall credit risk
and actively monitor these policies to reflect changes and scope of operations.
Xcel Energy and its subsidiaries conduct standard credit reviews for all counterparties. Xcel Energy employs additional credit risk
control mechanisms when appropriate, such as letters of credit, parental guarantees, standardized master netting agreements and
termination provisions that allow for offsetting of positive and negative exposures. The credit exposure is monitored and, when
necessary, the activity with a specific counterparty is limited until credit enhancement is provided.
liquidity and capital resources
cash flows
(Millions of dollars) 2002 2001 2000
Net cash provided by operating activities $1,715 $1,584 $1,408
management’s discussion and analysis
xcel energy inc. and subsidiaries page 33