Xcel Energy 2002 Annual Report Download - page 63
Download and view the complete annual report
Please find page 63 of the 2002 Xcel Energy annual report below. You can navigate through the pages in the report by either clicking on the pages listed below, or by using the keyword search tool below to find specific information within the annual report.-
 1
1 -
2
-
3
-
4
-
5
-
6
-
7
-
8
-
9
-
10
-
11
-
12
-
13
-
14
-
15
-
16
-
17
-
18
-
19
-
20
-
21
-
22
-
23
-
24
-
25
-
26
-
27
-
28
-
29
-
30
-
31
-
32
-
33
-
34
-
35
-
36
-
37
-
38
-
39
-
40
-
41
-
42
-
43
-
44
-
45
-
46
-
47
-
48
-
49
-
50
-
51
-
52
-
 53
53 -
 54
54 -
 55
55 -
 56
56 -
 57
57 -
 58
58 -
 59
59 -
 60
60 -
 61
61 -
 62
62 -
 63
63 -
 64
64 -
 65
65 -
 66
66 -
 67
67 -
 68
68 -
 69
69 -
 70
70 -
 71
71 -
 72
72 -
 73
73 -
74
-
75
-
76
-
77
-
78
-
79
-
80
-
81
-
82
-
83
-
84
-
85
-
86
-
87
-
88
-
89
-
90
 |
 |

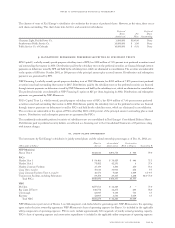
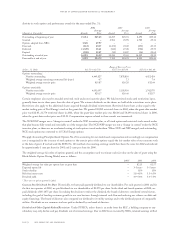
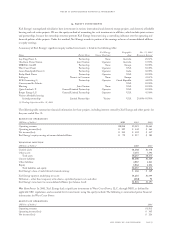
14.equity investments
Xcel Energy’s nonregulated subsidiaries have investments in various international and domestic energy projects, and domestic affordable
housing and real estate projects. We use the equity method of accounting for such investments in affiliates, which include joint ventures
and partnerships, because the ownership structure prevents Xcel Energy from exercising a controlling influence over the operating and
financial policies of the projects. Under this method, Xcel Energy records its portion of the earnings or losses of unconsolidated affiliates
as equity earnings.
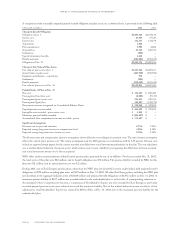
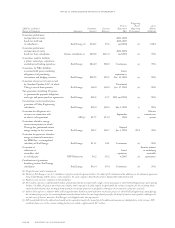
A summary of Xcel Energy’s significant equity method investments is listed in the following table:
Xcel Energy Geographic Dec. 31, 2002
Name Entity Form Owner Functions Area Economic Interest
Loy Yang Power A Partnership None Australia 25.37%
Gladstone Power Station Joint Venture Operator Australia 37.50%
MIBRAG GmbH Partnership None Europe 50.00%
West Coast Power Partnership Operator USA 50.00%
Lanco Kondapalli Power(1) Partnership Operator India 30.00%
Rocky Road Power Partnership Operator USA 50.00%
Schkopau Tenants in Common None Europe 41.67%
ECK Generating(1) Partnership Operator Czech Republic 44.50%
Commonwealth Atlantic USA 50.00%
Mustang Joint Venture None USA 50.00%
Quixx Linden L.P. General/Limited Partnership Operator USA 50.00%
Borger Energy L.P. General/Limited Partnership Operator USA 45.00%
Various affordable housing
limited partnerships Limited Partnerships Various USA 20.00%–99.99%
(1) Pending disposition at Dec. 31, 2002
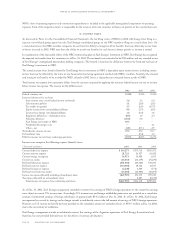
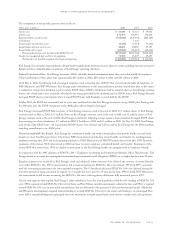
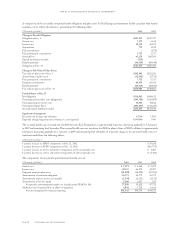
The following table summarizes financial information for these projects, including interests owned by Xcel Energy and other parties for
the years ended Dec. 31:
results of operations
(Millions of dollars) 2002 2001 2000
Operating revenues $2,516 $3,583 $4,664
Operating income (loss) $ 137 $ 442 $ 464
Net income (loss) $ 111 $ 422 $ 447
Xcel Energy’s equity earnings of unconsolidated affiliates $72 $ 217 $ 183
financial position
(Millions of dollars) 2002 2001
Current assets $1,102 $1,478
Other assets 7,155 7,396
Total assets $8,257 $8,874
Current liabilities $1,108 $1,229
Other liabilities 4,087 4,841
Equity 3,062 2,804
Total liabilities and equity $8,257 $8,874
Xcel Energy’s share of undistributed retained earnings $ 466 $ 449
Xcel Energy equity in underlying net assets $1,285 $1,099
Difference – other than temporary write-downs, capitalized project costs and other (284) 98
Xcel Energy’s investment in unconsolidated affiliates (per balance sheet) $1,001 $1,197
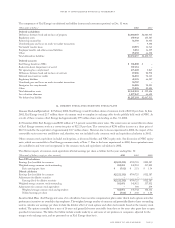
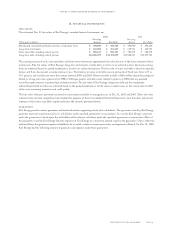
West Coast Power In 2001, Xcel Energy had a significant investment in West Coast Power, LLC, through NRG, as defined by
applicable SEC regulations, and accounted for its investments using the equity method. The following is summarized pretax financial
information for West Coast Power:
results of operations
(Millions of dollars) 2001
Operating revenues $1,562
Operating income (loss) $ 345
Net income (loss) $ 326
notes to consolidated financial statements
xcel energy inc. and subsidiaries page 77