Xcel Energy 2002 Annual Report Download - page 6
Download and view the complete annual report
Please find page 6 of the 2002 Xcel Energy annual report below. You can navigate through the pages in the report by either clicking on the pages listed below, or by using the keyword search tool below to find specific information within the annual report.-
 1
1 -
 2
2 -
 3
3 -
 4
4 -
 5
5 -
 6
6 -
 7
7 -
 8
8 -
 9
9 -
 10
10 -
 11
11 -
 12
12 -
 13
13 -
 14
14 -
 15
15 -
 16
16 -
 17
17 -
18
-
19
-
20
-
21
-
22
-
23
-
24
-
25
-
26
-
27
-
28
-
29
-
30
-
31
-
32
-
33
-
34
-
35
-
36
-
37
-
38
-
39
-
40
-
41
-
42
-
43
-
44
-
45
-
46
-
47
-
48
-
49
-
50
-
51
-
52
-
53
-
54
-
55
-
56
-
57
-
58
-
59
-
60
-
61
-
62
-
63
-
64
-
65
-
66
-
67
-
68
-
69
-
70
-
71
-
72
-
73
-
74
-
75
-
76
-
77
-
78
-
79
-
80
-
81
-
82
-
83
-
84
-
85
-
86
-
87
-
88
-
89
-
90
 |
 |

Short-term wholesale revenue increased by approximately $221 million, or 39 percent, in 2001. Short-term wholesale margin increased
$83 million, or 90.2 percent, in 2001. These increases are due to the expansion of Xcel Energy’s wholesale marketing operations and
favorable market conditions for the first six months of 2001, including strong prices in the western markets, particularly before the
establishment of price caps and other market changes.
Electric and natural gas commodity trading margins, including proprietary electric trading (i.e., not in electricity produced by Xcel
Energy’s own generating plants) and natural gas trading, increased approximately $48 million for the year ended Dec. 31, 2001, compared
with the same period in 2000. The increase reflects an expansion of Xcel Energy’s trading operations and favorable market conditions,
including strong prices in the western markets, particularly before the establishment of price caps and other market changes.
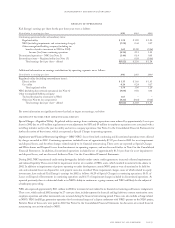
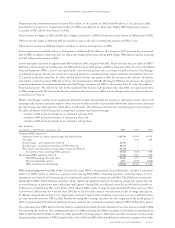
Natural Gas Utility Margins The following table details the changes in natural gas utility revenue and margin. The cost of natural gas
tends to vary with changing sales requirements and the unit cost of natural gas purchases. However, due to purchased natural gas cost
recovery mechanisms for retail customers, fluctuations in the cost of natural gas have little effect on natural gas margin.
(Millions of dollars) 2002 2001 2000
Natural gas utility revenue $ 1,398 $ 2,053 $ 1,469
Cost of natural gas purchased and transported (852) (1,518) (948)
Natural gas utility margin $ 546 $ 535 $ 521
2002 Comparison to 2001 Natural gas utility revenue decreased by $655 million, or 31.9 percent, while natural gas margins increased by
$11 million, or 2.1 percent. Natural gas revenue decreased largely due to decreases in the cost of natural gas, which are generally passed
through to customers. Natural gas utility margin increased due primarily to more favorable temperatures and sales growth.
2001 Comparison to 2000 Natural gas utility revenue increased by approximately $584 million, or 39.8 percent, for 2001, primarily due
to increases in the cost of natural gas, which are largely passed on to customers and recovered through various rate adjustment clauses in
most of the jurisdictions in which Xcel Energy operates. Natural gas utility margin increased by approximately $14 million, or 2.7 percent,
for 2001 due to sales growth and a rate increase in Colorado. These natural gas revenue and margin increases were partially offset by the
impact of warmer temperatures in 2001, which decreased natural gas revenue by approximately $38 million and natural gas margin by
approximately $16 million.
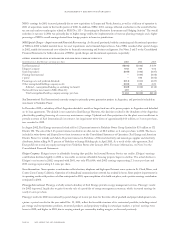
Nonregulated Operating Margins The following table details the changes in nonregulated revenue and margin included in
continuing operations.
(Millions of dollars) 2002 2001 2000
Nonregulated and other revenue $2,611 $2,580 $1,856
Earnings from equity investments 72 217 183
Nonregulated cost of goods sold (1,361) (1,319) (877)
Nonregulated margin $ 1,322 $ 1,478 $ 1,162
2002 Comparison to 2001 Nonregulated revenue from continuing operations increased slightly in 2002, reflecting growth from the
full-year impact of NRG’s 2001 generating facility acquisitions but partially offset by lower market prices. Nonregulated margin from
continuing operations decreased in 2002, due to decreased equity earnings. Earnings from equity investments for 2002 decreased
compared with 2001, primarily due to decreased equity earnings from NRG’s West Coast Power project, which experienced less
favorable long-term contracts and higher uncollectible receivables.
2001 Comparison to 2000 Nonregulated revenue and margin from continuing operations increased in 2001, largely due to NRG’s
acquisition of generating facilities, increased demand for electricity, market dynamics, strong performance from existing assets and higher
market prices for electricity. Earnings from equity investments for 2001 increased compared with 2000, primarily due to increased equity
earnings from NRG projects, which offset lower equity earnings from Yorkshire Power. As a result of a sales agreement to sell most of its
investment in Yorkshire Power, Xcel Energy did not record any equity earnings from Yorkshire Power after January 2001.
Non-Fuel Operating Expense and Other Items Other utility operating and maintenance expense for 2002 decreased by approximately
$4 million, or 0.3 percent. The decreased costs reflect lower incentive compensation and other employee benefit costs, as well as lower
staffing levels in corporate areas. These decreases were substantially offset by higher plant outage and property insurance costs, in addition
to inflationary factors such as market wage increases.
Other utility operating and maintenance expense for 2001 increased by approximately $60 million, or 4.1 percent, compared with 2000.
The change is largely due to increased plant outages, higher nuclear operating costs, bad debt reserves reflecting higher energy prices,
increased costs due to customer growth and higher performance-based incentive costs.
Other nonregulated operating and maintenance expenses for continuing operations increased $111 million in 2002 and increased
$143 million in 2001. These expenses are included in the results for each nonregulated subsidiary, as discussed later.
page 20 xcel energy inc. and subsidiaries
management’s discussion and analysis