Xcel Energy 2002 Annual Report Download - page 31
Download and view the complete annual report
Please find page 31 of the 2002 Xcel Energy annual report below. You can navigate through the pages in the report by either clicking on the pages listed below, or by using the keyword search tool below to find specific information within the annual report.-
 1
1 -
2
-
3
-
4
-
5
-
6
-
7
-
8
-
9
-
10
-
11
-
12
-
13
-
14
-
15
-
16
-
17
-
18
-
19
-
20
-
 21
21 -
 22
22 -
 23
23 -
 24
24 -
 25
25 -
 26
26 -
 27
27 -
 28
28 -
 29
29 -
 30
30 -
 31
31 -
 32
32 -
 33
33 -
 34
34 -
 35
35 -
 36
36 -
 37
37 -
 38
38 -
 39
39 -
 40
40 -
 41
41 -
42
-
43
-
44
-
45
-
46
-
47
-
48
-
49
-
50
-
51
-
52
-
53
-
54
-
55
-
56
-
57
-
58
-
59
-
60
-
61
-
62
-
63
-
64
-
65
-
66
-
67
-
68
-
69
-
70
-
71
-
72
-
73
-
74
-
75
-
76
-
77
-
78
-
79
-
80
-
81
-
82
-
83
-
84
-
85
-
86
-
87
-
88
-
89
-
90
 |
 |

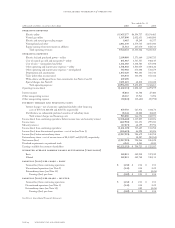
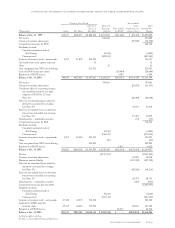
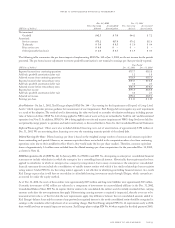
Year ended Dec. 31
(Thousands of dollars) 2002 2001 2000
operating activities
Net income (loss) $(2,217,991) $ 794,966 $ 526,828
Adjustments to reconcile net income to cash provided by operating activities:
Depreciation and amortization 1,028,494 945,555 828,780
Nuclear fuel amortization 48,675 41,928 44,591
Deferred income taxes (781,531) 11,190 62,716
Amortization of investment tax credits (13,272) (12,867) (15,295)
Allowance for equity funds used during construction (7,810) (6,829) 3,848
Undistributed equity in earnings of unconsolidated affiliates (16,478) (124,277) (87,019)
Gain on sale of property (6,785) ––
Write-downs and losses from investments 207,290 ––
Gain on sale of discontinued operations (2,814) ––
Noncash special charges – asset write-downs 3,160,374 – 41,991
Conservation incentive accrual adjustments (9,152) (49,271) 19,248
Unrealized gain on derivative financial instruments (8,407) (9,804) –
Extraordinary items – net of tax (see Note 15) –(10,287) 18,960
Change in accounts receivable 126,073 218,353 (443,347)
Change in inventories 8,620 (178,530) 21,933
Change in other current assets 67,596 340,478 (484,288)
Change in accounts payable 80,338 (325,946) 713,069
Change in other current liabilities 156,471 142,617 183,679
Change in other noncurrent assets (203,997) (329,442) (130,764)
Change in other noncurrent liabilities 99,417 136,178 102,795
Net cash provided by operating activities 1,715,111 1,584,012 1,407,725
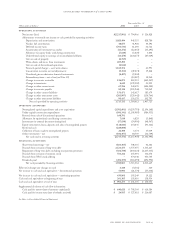
investing activities
Nonregulated capital expenditures and asset acquisitions (1,502,601) (4,259,791) (2,196,168)
Utility capital/construction expenditures (906,341) (1,105,989) (984,935)
Proceeds from sale of discontinued operations 160,791 ––
Allowance for equity funds used during construction 7,810 6,829 (3,848)
Investments in external decommissioning fund (57,830) (54,996) (48,967)
Equity investments, loans, deposits and sales of nonregulated projects (118,844) 154,845 (93,366)
Restricted cash (220,800) ––
Collection of loans made to nonregulated projects 22,498 6,374 17,039
Other investments – net (102,457) 84,769 (36,749)
Net cash used in investing activities (2,717,774) (5,167,959) (3,346,994)
financing activities
Short-term borrowings – net (663,365) 708,335 42,386
Proceeds from issuance of long-term debt 2,521,375 3,777,075 3,565,227
Repayment of long-term debt, including reacquisition premiums (362,760) (860,623) (1,667,335)
Proceeds from issuance of common stock 581,212 133,091 116,678
Proceeds from NRG stock offering –474,348 453,705
Dividends paid (496,375) (518,894) (494,992)
Net cash provided by financing activities 1,580,087 3,713,332 2,015,669
Effect of exchange rate changes on cash 6,448 (4,566) 360
Net increase in cash and cash equivalents – discontinued operations 56,096 (21,570) (57,638)
Net increase in cash and cash equivalents – continuing operations 639,968 103,249 19,122
Cash and cash equivalents at beginning of year 261,305 158,056 138,934
Cash and cash equivalents at end of year $ 901,273 $ 261,305 $ 158,056
Supplemental disclosure of cash flow information:
Cash paid for interest (net of amounts capitalized) $ 640,628 $ 708,560 $ 610,584
Cash paid for income taxes (net of refunds received) $ 24,935 $ 327,018 $ 216,087
See Notes to Consolidated Financial Statements
consolidated statements of cash flows
xcel energy inc. and subsidiaries page 45