Xcel Energy 2002 Annual Report Download - page 42
Download and view the complete annual report
Please find page 42 of the 2002 Xcel Energy annual report below. You can navigate through the pages in the report by either clicking on the pages listed below, or by using the keyword search tool below to find specific information within the annual report.-
 1
1 -
2
-
3
-
4
-
5
-
6
-
7
-
8
-
9
-
10
-
11
-
12
-
13
-
14
-
15
-
16
-
17
-
18
-
19
-
20
-
21
-
22
-
23
-
24
-
25
-
26
-
27
-
28
-
29
-
30
-
31
-
 32
32 -
 33
33 -
 34
34 -
 35
35 -
 36
36 -
 37
37 -
 38
38 -
 39
39 -
 40
40 -
 41
41 -
 42
42 -
 43
43 -
 44
44 -
 45
45 -
 46
46 -
 47
47 -
 48
48 -
 49
49 -
 50
50 -
 51
51 -
 52
52 -
53
-
54
-
55
-
56
-
57
-
58
-
59
-
60
-
61
-
62
-
63
-
64
-
65
-
66
-
67
-
68
-
69
-
70
-
71
-
72
-
73
-
74
-
75
-
76
-
77
-
78
-
79
-
80
-
81
-
82
-
83
-
84
-
85
-
86
-
87
-
88
-
89
-
90
 |
 |

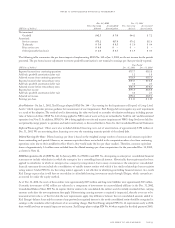
Reclassifications We reclassified certain items in the 2000 and 2001 statements of operations and the 2001 balance sheet to conform to the
2002 presentation. These reclassifications had no effect on net income or earnings per share. The reclassifications were primarily to
conform the presentation of all consolidated Xcel Energy subsidiaries to a standard corporate presentation.
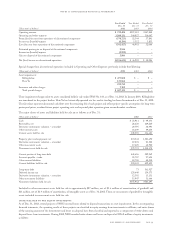
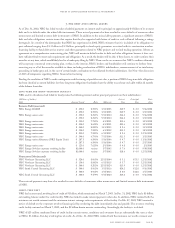
2. special charges and asset impairments
Special charges included in Operating Expenses for the years ended Dec. 31, 2002, 2001 and 2000, include the following:
(Millions of dollars) 2002 2001 2000
NRG special charges:
Asset impairments – continuing operations $2,545 $ – $ –
Financial restructuring and NEO costs 111 ––
Total NRG special charges 2,656 ––
Regulated utility special charges:
Regulatory recovery adjustment (SPS) 5––
Restaffing (utility and service companies) 939 –
Post-employment benefits (PSCo) –23 –
Merger costs – severance and related costs ––77
Merger costs – transaction-related ––52
Other merger costs – transition and integration ––70
Total regulated utility special charges 14 62 199
Other nonregulated special charges:
Asset impairments 16 –42
Holding company NRG restructuring charges 5––
Total nonregulated special charges 21 –42
Total special charges $2,691 $62 $241
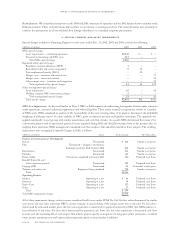
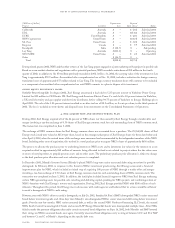
NRG Asset Impairments As discussed further in Note 4, NRG in 2002 experienced credit-rating downgrades, defaults under numerous
credit agreements, increased collateral requirements and reduced liquidity. These events resulted in impairment reviews of a number
of NRG assets. NRG completed an analysis of the recoverability of the asset-carrying values of its projects, factoring in the probability
weighting of different courses of action available to NRG, given its financial position and liquidity constraints. This approach was
applied consistently to asset groups with similar uncertainties and cash flow streams. As a result, NRG determined that many of its
construction projects and its operational projects became impaired during 2002 and should be written down to fair market value. In
applying those provisions, NRG management considered cash flow analyses, bids and offers related to those projects. The resulting
impairments were recognized as Special Charges in 2002, as follows:
(Millions of dollars) Status Pretax Charge Fair Value Basis
Projects in Construction or Development
Nelson Terminated $ 468 Similar asset prices
Pike Terminated – Chapter 7 involuntary
bankruptcy petition filed October 2002 402 Similar asset prices
Bourbonnais Terminated 265 Similar asset prices
Meriden Terminated 144 Similar asset prices
Brazos Valley Foreclosure completed in January 2003 103 Projected cash flows
Kendall, Batesville and
other expansion projects Terminated 120 Projected cash flows
Langage (UK) Terminated 42 Estimated market price
Turbines and other costs Equipment being marketed 702 Similar asset prices
Total $2,246
Operating Projects
Audrain Operating at a loss $ 66 Projected cash flows
Somerset Operating at a loss 49 Projected cash flows
Bayou Cove Operating at a loss 127 Projected cash flows
Other Operating at a loss 57 Projected cash flows
Total $299
Total NRG impairment charges $2,545
All of these impairment charges relate to assets considered held for use under SFAS No. 144. For fair values determined by similar
asset prices, the fair value represents NRG’s current estimate of recoverability, if the project assets were to be sold. For fair values
determined by estimated market price, the fair value represents a market bid or appraisal received by NRG that NRG believes is
best reflective of fair value. For fair values determined by projected cash flows, the fair value represents a discounted cash flow
amount over the remaining life of each project that reflects project-specific assumptions for long-term power pool prices, escalated
future project operating costs and expected plant operation given assumed market conditions.
page 56 xcel energy inc. and subsidiaries
notes to consolidated financial statements