Xcel Energy 2002 Annual Report Download - page 84
Download and view the complete annual report
Please find page 84 of the 2002 Xcel Energy annual report below. You can navigate through the pages in the report by either clicking on the pages listed below, or by using the keyword search tool below to find specific information within the annual report.-
 1
1 -
2
-
3
-
4
-
5
-
6
-
7
-
8
-
9
-
10
-
11
-
12
-
13
-
14
-
15
-
16
-
17
-
18
-
19
-
20
-
21
-
22
-
23
-
24
-
25
-
26
-
27
-
28
-
29
-
30
-
31
-
32
-
33
-
34
-
35
-
36
-
37
-
38
-
39
-
40
-
41
-
42
-
43
-
44
-
45
-
46
-
47
-
48
-
49
-
50
-
51
-
52
-
53
-
54
-
55
-
56
-
57
-
58
-
59
-
60
-
61
-
62
-
63
-
64
-
65
-
66
-
67
-
68
-
69
-
70
-
71
-
72
-
73
-
 74
74 -
 75
75 -
 76
76 -
 77
77 -
 78
78 -
 79
79 -
 80
80 -
 81
81 -
 82
82 -
 83
83 -
 84
84 -
 85
85 -
 86
86 -
 87
87 -
 88
88 -
 89
89 -
 90
90
 |
 |

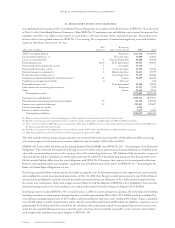
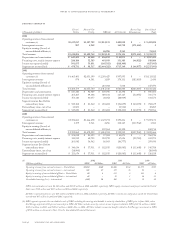
business segments
Electric Natural Gas Reconciling Consolidated
(Thousands of dollars) Utility Utility NRG(b) All Other(b) Eliminations Total
2002
Operating revenues from external
customers(a) $5,437,017 $1,397,799 $ 2,212,153 $405,839 $ – $ 9,452,808
Intersegment revenues 987 4,949 – 165,732 (171,665) 3
Equity in earnings (losses) of
unconsolidated affiliates(a) ––68,996 2,565 – 71,561
Total revenues $5,438,004 $1,402,748 $ 2,281,149 $574,136 $(171,665) $ 9,524,372
Depreciation and amortization $647,491 $ 92,868 $ 256,199 $ 40,871 $ – $ 1,037,429
Financing costs, mainly interest expense 286,180 52,583 493,956 131,383 (46,022) 918,080
Income tax expense (credit) 301,875 53,831 (165,382) (818,309) – (627,985)
Segment net income (loss) $478,711 $ 98,517 $(3,464,282) $715,140 $ (46,077) $ (2,217,991)
2001
Operating revenues from external
customers(a) $6,463,401 $2,051,199 $ 2,201,427 $397,895 $ – $11,113,922
Intersegment revenues 978 4,501 1,859 178,111 (183,019) 2,430
Equity in earnings (losses) of
unconsolidated affiliates(a) ––210,032 7,038 – 217,070
Total revenues $6,464,379 $2,055,700 $ 2,413,318 $583,044 $(183,019) $11,333,422
Depreciation and amortization $ 617,320 $ 92,989 $ 169,596 $ 26,398 $ – $ 906,303
Financing costs, mainly interest expense 265,285 49,108 389,311 115,127 (52,055) 766,776
Income tax expense (credit) 351,181 41,077 28,052 (88,939) – 331,371
Segment income (loss) before
extraordinary items $ 535,182 $ 81,562 $ 265,204 $ (56,879) $ (40,390) $ 784,679
Extraordinary items, net of tax 11,821 – – (1,534) – 10,287
Segment net income (loss) $ 547,003 $ 81,562 $ 265,204 $ (58,413) $ (40,390) $ 794,966
2000
Operating revenues from external
customers(a) $5,704,683 $1,466,478 $ 1,670,774 $195,236 $ – $ 9,037,171
Intersegment revenues 1,179 5,761 2,256 132,347 (137,962) 3,581
Equity in earnings (losses) of
unconsolidated affiliates(a) ––139,364 43,350 – 182,714
Total revenues $5,705,862 $1,472,239 $ 1,812,394 $370,933 $(137,962) $ 9,223,466
Depreciation and amortization $ 574,018 $ 85,353 $ 97,304 $ 10,071 $ – $ 766,746
Financing costs, mainly interest expense 333,512 60,755 250,790 67,696 (59,780) 652,973
Income tax expense (credit) 261,942 36,962 86,903 (86,777) – 299,030
Segment income (loss) before
extraordinary items $ 340,634 $ 57,911 $ 182,935 $ (20,083) $ (15,609) $ 545,788
Extraordinary items, net of tax (18,960) ––––(18,960)
Segment net income (loss) $ 321,674 $ 57,911 $ 182,935 $ (20,083) $ (15,609) $ 526,828
(a) 2002 2001 2000
(Millions of dollars) NRG All Other NRG All Other NRG All Other
Operating revenues from external customers – United States $1,874 $369 $1,886 $362 $1,575 $195
Operating revenues from external customers – international 338 37 315 36 96 –
Equity in earnings of unconsolidated affiliates – United States 20 3 151 6 121 8
Equity in earnings of unconsolidated affiliates – international 49 – 59 1 18 35
Consolidated earnings (loss) – international (695) 18 100 6 39 29
NRG’s international assets were $2,368 million and $3,199 million in 2002 and 2001, respectively. NRG’s equity investments and projects outside the United
States were $310 million and $417 million in 2002 and 2001, respectively.
All Other’s international assets were $69 million and $138 million in 2002 and 2001, respectively. All Other’s investments and projects outside the United States
were $0 and $37 million in 2002 and 2001, respectively.
(b) NRG segment represents the consolidated results of NRG excluding the earnings attributable to minority shareholders of NRG prior to June 2002, when
Xcel Energy acquired a 100-percent ownership in NRG. All Other includes minority interest income (expense) related to NRG of $13.6 million in 2002,
$(65.6) million in 2001, and $(29.2) million in 2000. Also, in 2002, All Other includes income tax benefits related to Xcel Energy’s investment in NRG
of $706 million, as discussed in Note 11 to the Consolidated Financial Statements.
page 98 xcel energy inc. and subsidiaries
notes to consolidated financial statements