Xcel Energy 2002 Annual Report Download - page 62
Download and view the complete annual report
Please find page 62 of the 2002 Xcel Energy annual report below. You can navigate through the pages in the report by either clicking on the pages listed below, or by using the keyword search tool below to find specific information within the annual report.-
 1
1 -
2
-
3
-
4
-
5
-
6
-
7
-
8
-
9
-
10
-
11
-
12
-
13
-
14
-
15
-
16
-
17
-
18
-
19
-
20
-
21
-
22
-
23
-
24
-
25
-
26
-
27
-
28
-
29
-
30
-
31
-
32
-
33
-
34
-
35
-
36
-
37
-
38
-
39
-
40
-
41
-
42
-
43
-
44
-
45
-
46
-
47
-
48
-
49
-
50
-
51
-
 52
52 -
 53
53 -
 54
54 -
 55
55 -
 56
56 -
 57
57 -
 58
58 -
 59
59 -
 60
60 -
 61
61 -
 62
62 -
 63
63 -
 64
64 -
 65
65 -
 66
66 -
 67
67 -
 68
68 -
 69
69 -
 70
70 -
 71
71 -
 72
72 -
73
-
74
-
75
-
76
-
77
-
78
-
79
-
80
-
81
-
82
-
83
-
84
-
85
-
86
-
87
-
88
-
89
-
90
 |
 |

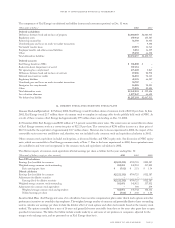
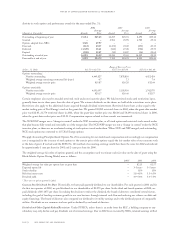
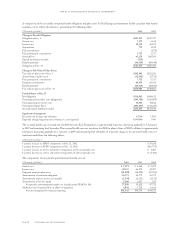
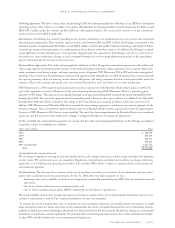
A comparison of the actuarially computed benefit obligation and plan assets for Xcel Energy postretirement health care plans that benefit
employees of its utility subsidiaries is presented in the following table:
(Thousands of dollars) 2002 2001
Change in Benefit Obligation
Obligation at Jan. 1 $687,455 $576,727
Service cost 7,173 6,160
Interest cost 50,135 46,579
Acquisitions 773 3,212
Plan amendments –(278)
Plan participants’ contributions 5,755 3,517
Actuarial loss 61,276 100,386
Special termination benefits (173) –
Benefit payments (44,419) (48,848)
Obligation at Dec. 31 $767,975 $687,455
Change in Fair Value of Plan Assets
Fair value of plan assets at Jan. 1 $242,803 $223,266
Actual return on plan assets (13,632) (3,701)
Plan participants’ contributions 5,755 3,517
Employer contributions 60,476 68,569
Benefit payments (44,419) (48,848)
Fair value of plan assets at Dec. 31 $250,983 $242,803
Funded Status at Dec. 31
Net obligation $516,992 $444,652
Unrecognized transition asset (obligation) (169,328) (186,099)
Unrecognized prior service cost 10,904 12,812
Unrecognized gain (loss) (206,601) (134,225)
Accrued benefit liability recorded $151,967 $137,140
Significant Assumptions
Discount rate for year-end valuation 6.75% 7.25%
Expected average long-term rate of return on assets (pretax) 8.0–9.0% 9.0%
The assumed health care cost trend rate for 2002 for most Xcel Energy plans is approximately 8 percent, decreasing gradually to 5.5 percent
in 2007 and remaining level thereafter. The assumed health care cost trend rate for 2002 for plans of four of NRG’s affiliates is approximately
12 percent, decreasing gradually to 5.5 percent in 2009 and remaining level thereafter. A 1-percent change in the assumed health care cost
trend rate would have the following effects:
(Thousands of dollars)
1-percent increase in APBO components at Dec. 31, 2002 $ 79,028
1-percent decrease in APBO components at Dec. 31, 2002 $(65,755)
1-percent increase in service and interest components of the net periodic cost $ 6,285
1-percent decrease in service and interest components of the net periodic cost $ (5,181)
The components of net periodic postretirement benefit cost are:
(Thousands of dollars) 2002 2001 2000
Service cost $ 7,173 $ 6,160 $ 5,679
Interest cost 50,135 46,579 43,477
Expected return on plan assets (21,030) (18,920) (17,902)
Amortization of transition obligation 16,771 16,771 16,773
Amortization of prior service cost (credit) (1,130) (1,235) (1,211)
Amortization of net loss (gain) 5,380 1,457 915
Net periodic postretirement benefit cost (credit) under SFAS No. 106 57,299 50,812 47,731
Additional cost recognized due to effects of regulation 4,043 3,738 6,641
Net cost recognized for financial reporting $61,342 $54,550 $54,372
page 76 xcel energy inc. and subsidiaries
notes to consolidated financial statements