Xcel Energy 2002 Annual Report Download - page 3
Download and view the complete annual report
Please find page 3 of the 2002 Xcel Energy annual report below. You can navigate through the pages in the report by either clicking on the pages listed below, or by using the keyword search tool below to find specific information within the annual report.-
 1
1 -
 2
2 -
 3
3 -
 4
4 -
 5
5 -
 6
6 -
 7
7 -
 8
8 -
 9
9 -
 10
10 -
 11
11 -
 12
12 -
 13
13 -
 14
14 -
15
-
16
-
17
-
18
-
19
-
20
-
21
-
22
-
23
-
24
-
25
-
26
-
27
-
28
-
29
-
30
-
31
-
32
-
33
-
34
-
35
-
36
-
37
-
38
-
39
-
40
-
41
-
42
-
43
-
44
-
45
-
46
-
47
-
48
-
49
-
50
-
51
-
52
-
53
-
54
-
55
-
56
-
57
-
58
-
59
-
60
-
61
-
62
-
63
-
64
-
65
-
66
-
67
-
68
-
69
-
70
-
71
-
72
-
73
-
74
-
75
-
76
-
77
-
78
-
79
-
80
-
81
-
82
-
83
-
84
-
85
-
86
-
87
-
88
-
89
-
90
 |
 |

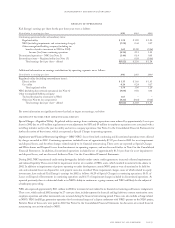
results of operations
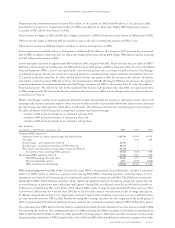
Xcel Energy’s earnings per share for the past three years were as follows:
Contribution to earnings per share 2002 2001 2000
Continuing operations before extraordinary items:
Regulated utility $1.59 $ 1.90 $ 1.20
NRG (including impairments and restructuring charges) (7.58) 0.44 0.37
Other nonregulated/holding company (including tax
benefits related to investment in NRG in 2002) 1.63 (0.21) (0.06)
Income (loss) from continuing operations (4.36) 2.13 1.51
Discontinued operations – NRG (see Note 3) (1.46) 0.14 0.09
Extraordinary items – Regulated utility (see Note 15) –0.03 (0.06)
Total earnings (loss) per share – diluted $(5.82) $ 2.30 $ 1.54
Additional information on earnings contributions by operating segments are as follows:
Contribution to earnings per share 2002 2001 2000
Regulated utility (including extraordinary items):
Electric utility $1.33 $ 1.66 $ 1.03
Gas utility 0.26 0.24 0.17
Total regulated utility 1.59 1.90 1.20
NRG (including discontinued operations) (see Note 3) (9.04) 0.58 0.46
Other nonregulated/holding company:
Tax benefit related to investment in NRG 1.85 ––
Other (see Note 21 for components) (0.22) (0.18) (0.12)
Total earnings (loss) per share – diluted $(5.82) $ 2.30 $ 1.54
For more information on significant factors that had an impact on earnings, see below.
significant factors that impacted 2002 results
Special Charges – Regulated Utility Regulated utility earnings from continuing operations were reduced by approximately 2 cents per
share in 2002 due to a $5-million regulatory recovery adjustment for SPS and $9 million in employee separation costs associated with a
restaffing initiative early in the year for utility and service company operations. See Note 2 to the Consolidated Financial Statements for
further discussion of these items, which are reported as Special Charges in operating expenses.
Impairment and Financial Restructuring Charges – NRG NRG’s losses from both continuing and discontinued operations were affected
by charges recorded in 2002. Continuing operations included losses of approximately $7.07 per share in 2002 for asset impairment
and disposal losses, and for other charges related mainly to its financial restructuring. These costs are reported as Special Charges
and Write-downs and Disposal Losses from Investments in operating expenses, and are discussed further in Note 2 to the Consolidated
Financial Statements. In addition, discontinued operations included losses of approximately $1.56 per share for asset impairments
and disposal losses, and are discussed further in Note 3 to the Consolidated Financial Statements.
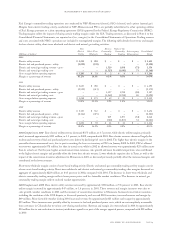
During 2002, NRG experienced credit-rating downgrades, defaults under certain credit agreements, increased collateral requirements
and reduced liquidity. These events led to impairment reviews of a number of NRG assets, which resulted in material write-downs in
2002. In addition to impairments of projects operating or under development, certain NRG projects were determined to be held for
sale, and estimated losses on disposal for such projects were also recorded. These impairment charges, some of which related to equity
investments, have reduced Xcel Energy’s earnings for 2002 as follows: $6.29 of Special Charges in continuing operations, $0.51 of
Losses on Disposal of Investments in continuing operations and $1.57 of impairment charges included in discontinued operations. As
reported previously, there is substantial doubt as to NRG’s ability to continue as a going concern, and NRG will likely be the subject of
a bankruptcy proceeding.
NRG also expensed approximately $111 million in 2002 for incremental costs related to its financial restructuring and business realignment.
These costs, which reduced 2002 earnings by 27 cents per share, include expenses for financial and legal advisors, contract termination costs,
employee separation and other incremental costs incurred during the financial restructuring period. These costs also include a charge related
to NRG’s NEO landfill gas generation operations for the estimated impact of a dispute settlement with NRG’s partner on the NEO project,
Fortistar. Most of these costs were paid in 2002. See Note 2 to the Consolidated Financial Statements for discussion of accrued financial
restructuring cost activity related to NRG.
management’s discussion and analysis
xcel energy inc. and subsidiaries page 17