Xcel Energy 2002 Annual Report Download - page 5
Download and view the complete annual report
Please find page 5 of the 2002 Xcel Energy annual report below. You can navigate through the pages in the report by either clicking on the pages listed below, or by using the keyword search tool below to find specific information within the annual report.-
 1
1 -
 2
2 -
 3
3 -
 4
4 -
 5
5 -
 6
6 -
 7
7 -
 8
8 -
 9
9 -
 10
10 -
 11
11 -
 12
12 -
 13
13 -
 14
14 -
 15
15 -
 16
16 -
17
-
18
-
19
-
20
-
21
-
22
-
23
-
24
-
25
-
26
-
27
-
28
-
29
-
30
-
31
-
32
-
33
-
34
-
35
-
36
-
37
-
38
-
39
-
40
-
41
-
42
-
43
-
44
-
45
-
46
-
47
-
48
-
49
-
50
-
51
-
52
-
53
-
54
-
55
-
56
-
57
-
58
-
59
-
60
-
61
-
62
-
63
-
64
-
65
-
66
-
67
-
68
-
69
-
70
-
71
-
72
-
73
-
74
-
75
-
76
-
77
-
78
-
79
-
80
-
81
-
82
-
83
-
84
-
85
-
86
-
87
-
88
-
89
-
90
 |
 |

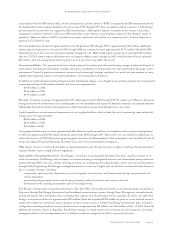
Xcel Energy’s commodity trading operations are conducted by NSP-Minnesota (electric), PSCo (electric) and e prime (natural gas).
Margins from electric trading activity, conducted at NSP-Minnesota and PSCo, are partially redistributed to other operating utilities
of Xcel Energy, pursuant to a joint operating agreement (JOA) approved by the Federal Energy Regulatory Commission (FERC).
Trading margins reflect the impact of sharing certain trading margins under the ICA. Trading revenues, as discussed in Note 1 to the
Consolidated Financial Statements, are reported net (i.e., margins) in the Consolidated Statements of Operations. Trading revenue
and costs associated with NRG’s operations are included in nonregulated margins. The following table details the revenue and margin
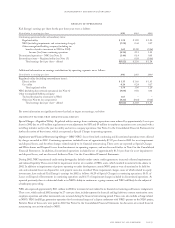
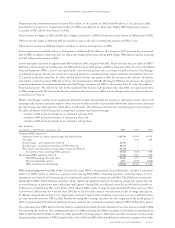
for base electric utility, short-term wholesale and electric and natural gas trading activities.
Base Electric Natural Gas
Electric Short-Term Commodity Commodity Intercompany Consolidated
(Millions of dollars) Utility Wholesale Trading Trading Eliminations Totals
2002
Electric utility revenue $ 5,232 $ 203 $ – $ – $ – $ 5,435
Electric fuel and purchased power – utility (2,029) (170) – – – (2,199)
Electric and natural gas trading revenue – gross ––1,529 1,898 (71) 3,356
Electric and natural gas trading costs ––(1,527) (1,892) 71 (3,348)
Gross margin before operating expenses $ 3,203 $ 33 $ 2 $ 6 $ – $ 3,244
Margin as a percentage of revenue 61.2% 16.3% 0.1% 0.3% – 36.9%
2001
Electric utility revenue $ 5,607 $ 788 $ – $ – $ – $ 6,395
Electric fuel and purchased power – utility (2,559) (613) – – – (3,172)
Electric and natural gas trading revenue – gross – – 1,337 1,938 (88) 3,187
Electric and natural gas trading costs – – (1,268) (1,918) 88 (3,098)
Gross margin before operating expenses $ 3,048 $ 175 $ 69 $ 20 $ – $ 3,312
Margin as a percentage of revenue 54.4% 22.2% 5.2% 1.0% – 34.6%
2000
Electric utility revenue $ 5,107 $ 567 $ – $ – $ – $ 5,674
Electric fuel and purchased power – utility (2,106) (475) – – – (2,581)
Electric and natural gas trading revenue – gross – – 819 1,297 (54) 2,062
Electric and natural gas trading costs – – (788) (1,287) 54 (2,021)
Gross margin before operating expenses $ 3,001 $ 92 $ 31 $ 10 $ – $ 3,134
Margin as a percentage of revenue 58.8% 16.2% 3.8% 0.8% – 40.5%
2002 Comparison to 2001 Base electric utility revenue decreased $375 million, or 6.7 percent, while electric utility margins, primarily
retail, increased approximately $155 million, or 5.1 percent, in 2002, compared with 2001. Base electric revenues decreased largely due
to decreased recovery of fuel and purchased power costs driven by declining fuel costs in 2002. The higher base electric margins in the
year reflect lower unrecovered costs, due in part to resetting the base-cost recovery at PSCo in January 2002. In 2001, PSCo’s allowed
recovery was approximately $78 million less than its actual costs, while in 2002 its allowed recovery was approximately $29 million more
than its actual cost. For the year, higher accrued conservation revenues, sales growth and more favorable temperatures also contributed
to the higher electric margins and partially offset the lower base electric revenue. Lower wholesale capacity sales in Texas, as well as the
impact of the conservation incentive adjustment in Minnesota in 2001, as discussed previously, partially offset the increased margins and
contributed to the lower revenues.
Short-term wholesale margins consist of asset-based trading activity. Electric and natural gas commodity trading activity margins consist
of non-asset-based trading activity. Short-term wholesale and electric and natural gas commodity trading sales margins decreased an
aggregate of approximately $223 million, or 84.5 percent, in 2002, compared with 2001. The decrease in short-term wholesale and
electric commodity trading margin reflects lower power prices and less favorable market conditions. The decrease in natural gas
commodity trading margin reflects reduced market opportunities.
2001 Comparison to 2000 Base electric utility revenue increased by approximately $500 million, or 9.8 percent, in 2001. Base electric
utility margin increased by approximately $47 million, or 1.6 percent, in 2001. These revenue and margin increases were due to
sales growth, weather conditions in 2001 and the recovery of conservation incentives in Minnesota. Increased conservation incentives,
including the resolution of the 1998 dispute, as discussed previously, and accrued 2001 incentives, increased revenue and margin by
$49 million. More favorable weather during 2001 increased revenue by approximately $23 million and margin by approximately
$13 million. These increases were partially offset by increases in fuel and purchased power costs, which are not completely recoverable
from customers in Colorado due to various cost-sharing mechanisms. Revenue and margin also were reduced in 2001 by approximately
$30 million due to rate reductions in various jurisdictions agreed to as part of the merger approval process, compared with $10 million
in 2000.
management’s discussion and analysis
xcel energy inc. and subsidiaries page 19