Pizza Hut 2010 Annual Report Download - page 75
Download and view the complete annual report
Please find page 75 of the 2010 Pizza Hut annual report below. You can navigate through the pages in the report by either clicking on the pages listed below, or by using the keyword search tool below to find specific information within the annual report.-
 1
1 -
2
-
3
-
4
-
5
-
6
-
7
-
8
-
9
-
10
-
11
-
12
-
13
-
14
-
15
-
16
-
17
-
18
-
19
-
20
-
21
-
22
-
23
-
24
-
25
-
26
-
27
-
28
-
29
-
30
-
31
-
32
-
33
-
34
-
35
-
36
-
37
-
38
-
39
-
40
-
41
-
42
-
43
-
44
-
45
-
46
-
47
-
48
-
49
-
50
-
51
-
52
-
53
-
54
-
55
-
56
-
57
-
58
-
59
-
60
-
61
-
62
-
63
-
64
-
 65
65 -
 66
66 -
 67
67 -
 68
68 -
 69
69 -
 70
70 -
 71
71 -
 72
72 -
 73
73 -
 74
74 -
 75
75 -
 76
76 -
 77
77 -
 78
78 -
 79
79 -
 80
80 -
 81
81 -
 82
82 -
 83
83 -
 84
84 -
 85
85 -
86
-
87
-
88
-
89
-
90
-
91
-
92
-
93
-
94
-
95
-
96
-
97
-
98
-
99
-
100
-
101
-
102
-
103
-
104
-
105
-
106
-
107
-
108
-
109
-
110
-
111
-
112
-
113
-
114
-
115
-
116
-
117
-
118
-
119
-
120
-
121
-
122
-
123
-
124
-
125
-
126
-
127
-
128
-
129
-
130
-
131
-
132
-
133
-
134
-
135
-
136
-
137
-
138
-
139
-
140
-
141
-
142
-
143
-
144
-
145
-
146
-
147
-
148
-
149
-
150
-
151
-
152
-
153
-
154
-
155
-
156
-
157
-
158
-
159
-
160
-
161
-
162
-
163
-
164
-
165
-
166
-
167
-
168
-
169
-
170
-
171
-
172
-
173
-
174
-
175
-
176
-
177
-
178
-
179
-
180
-
181
-
182
-
183
-
184
-
185
-
186
-
187
-
188
-
189
-
190
-
191
-
192
-
193
-
194
-
195
-
196
-
197
-
198
-
199
-
200
-
201
-
202
-
203
-
204
-
205
-
206
-
207
-
208
-
209
-
210
-
211
-
212
-
213
-
214
-
215
-
216
-
217
-
218
-
219
-
220
-
221
-
222
-
223
-
224
-
225
-
226
-
227
-
228
-
229
-
230
-
231
-
232
-
233
-
234
-
235
-
236
 |
 |

9MAR201101440694
Proxy Statement
56
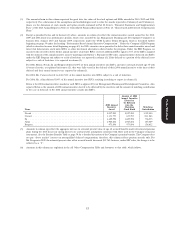
(2) Reflects grants of PSUs subject to performance-based vesting conditions under the Long Term Incentive Plan in 2010. The PSUs vest on February 5, 2013,
subject to the Company’s achievement of specified earnings per share (‘‘EPS’’) growth during the performance period ending on December 29, 2012. The
performance target for all the PSU awards granted to the NEOs in 2010 is compounded annual EPS growth of 10%, determined by comparing EPS as
measured at the end of the performance period to base EPS (2009 EPS). Both base EPS and EPS for the performance period are adjusted to exclude
certain items as described on page 43 of this proxy statement. If the 10% growth target is achieved, 100% of the PSUs will pay out in shares of Company
stock. If less than 7% compounded EPS growth is achieved, there will be no payout. If EPS growth is at or above 16%, PSUs pay out at the maximum,
which is 200% of target. If EPS growth is at or above the 7% threshold but below the 16% maximum, the awards will pay out in proportion to the level of
EPS growth achieved between the threshold and the target and between the target and the maximum, as applicable. The terms of the PSUs provide that in
case of a change in control during the first year of the award shares will be distributed assuming target performance was achieved subject to reduction to
reflect the portion of the performance period following the change in control. In case of a change in control after the first year of the award, shares will be
distributed assuming performance at the greater of target level or projected level at the time of the change in control subject to reduction to reflect the
portion of the performance period following the change in control.
(3) The amount in this column reflects the May 2010 Restricted Stock Unit (‘‘RSUs’’) retention award approved by the Management Planning and
Development Committee to Mr. Su based on his strong leadership and the performance of the China Division. The award vests after 5 years and had a
grant date fair value of $7 million. The award will be paid to Mr. Su in shares of YUM Common Stock twelve months following his retirement provided he
does not leave the Company before the award vests.
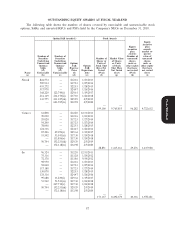
(4) Amounts in this column reflect the number of 2010 stock appreciation rights (‘‘SARs’’) and stock options granted to executives during the Company’s 2010
fiscal year. For each executive, the grants were made February 5, 2010. SARs/stock options become exercisable in equal installments on the first, second,
third and fourth anniversaries of the grant date. The terms of each SAR/stock option grant provides that, in case of a change in control, all outstanding
awards become exercisable immediately. SARs allow the grantee to receive the number of shares of YUM common stock that is equal in value to the
appreciation in YUM common stock with respect to the number of SARs granted from the date of grant to the date of exercise.
Participants who have attained age 55 with 10 years of service who terminate employment may exercise SARs/stock options that were vested on their date
of termination through the expiration date of the SAR/stock option (generally, the tenth anniversary following the SARs/stock options grant date). Vested
SARs/stock options of grantees who die may also be exercised by the grantee’s beneficiary through the expiration date of the vested SARs/stock options
and the grantees unvested SARs/stock options expire on the grantees’ death. If a grantee’s employment is terminated due to gross misconduct, the entire
award is forfeited. For other employment terminations, all SARs/stock options expire upon termination of employment.
(5) The exercise price of all SARs/stock options granted in 2010 equals the closing price of YUM common stock on the grant date, February 5, 2010.
(6) Amounts in this column reflect the full grant date fair value of the PSUs shown in column (g), RSUs shown in column (i) and the SARs/stock options
shown in column (j). These amounts reflect the amounts to be recognized by the Company as accounting expense and do not correspond to the actual
value that will be recognized by the NEOs. The grant date fair value is the amount that the Company is expensing in its financial statements over the
award’s vesting schedule. For PSUs and RSUs, fair value was calculated using the closing price of the Company’s common stock on the date of grant. For
SARs/stock options, fair value was calculated using the Black-Scholes value on the grant date of $8.06. For additional information regarding valuation
assumptions of SARs/stock options, see the discussion of stock awards and option awards contained in Part II, Item 8, ‘‘Financial Statements and
Supplementary Data’’ of the 2010 Annual Report in Notes to Consolidated Financial Statements at Note 15, ‘‘Share-based and Deferred Compensation
Plans.’’
There can be no assurance that the SARs/stock options will ever be exercised or PSUs/RSUs paid out (in which case no value will be realized by the
executive) or that the value upon exercise or payout will equal the grant date fair value.