Pizza Hut 2010 Annual Report Download - page 49
Download and view the complete annual report
Please find page 49 of the 2010 Pizza Hut annual report below. You can navigate through the pages in the report by either clicking on the pages listed below, or by using the keyword search tool below to find specific information within the annual report.-
 1
1 -
2
-
3
-
4
-
5
-
6
-
7
-
8
-
9
-
10
-
11
-
12
-
13
-
14
-
15
-
16
-
17
-
18
-
19
-
20
-
21
-
22
-
23
-
24
-
25
-
26
-
27
-
28
-
29
-
30
-
31
-
32
-
33
-
34
-
35
-
36
-
37
-
38
-
 39
39 -
 40
40 -
 41
41 -
 42
42 -
 43
43 -
 44
44 -
 45
45 -
 46
46 -
 47
47 -
 48
48 -
 49
49 -
 50
50 -
 51
51 -
 52
52 -
 53
53 -
 54
54 -
 55
55 -
 56
56 -
 57
57 -
 58
58 -
 59
59 -
60
-
61
-
62
-
63
-
64
-
65
-
66
-
67
-
68
-
69
-
70
-
71
-
72
-
73
-
74
-
75
-
76
-
77
-
78
-
79
-
80
-
81
-
82
-
83
-
84
-
85
-
86
-
87
-
88
-
89
-
90
-
91
-
92
-
93
-
94
-
95
-
96
-
97
-
98
-
99
-
100
-
101
-
102
-
103
-
104
-
105
-
106
-
107
-
108
-
109
-
110
-
111
-
112
-
113
-
114
-
115
-
116
-
117
-
118
-
119
-
120
-
121
-
122
-
123
-
124
-
125
-
126
-
127
-
128
-
129
-
130
-
131
-
132
-
133
-
134
-
135
-
136
-
137
-
138
-
139
-
140
-
141
-
142
-
143
-
144
-
145
-
146
-
147
-
148
-
149
-
150
-
151
-
152
-
153
-
154
-
155
-
156
-
157
-
158
-
159
-
160
-
161
-
162
-
163
-
164
-
165
-
166
-
167
-
168
-
169
-
170
-
171
-
172
-
173
-
174
-
175
-
176
-
177
-
178
-
179
-
180
-
181
-
182
-
183
-
184
-
185
-
186
-
187
-
188
-
189
-
190
-
191
-
192
-
193
-
194
-
195
-
196
-
197
-
198
-
199
-
200
-
201
-
202
-
203
-
204
-
205
-
206
-
207
-
208
-
209
-
210
-
211
-
212
-
213
-
214
-
215
-
216
-
217
-
218
-
219
-
220
-
221
-
222
-
223
-
224
-
225
-
226
-
227
-
228
-
229
-
230
-
231
-
232
-
233
-
234
-
235
-
236
 |
 |

9MAR201101440694
EXECUTIVE COMPENSATION
Compensation Discussion and Analysis
Introduction
This Compensation Discussion and Analysis (‘‘CD&A’’) describes the principles of our executive
compensation program, how we applied those principles in compensating our Named Executive Officers
(‘‘NEOs’’) for fiscal year 2010, and how our compensation program drives performance.
In this CD&A, we first provide an executive summary of our program for fiscal 2010. We then
describe our compensation philosophy and objectives of our executive compensation program and how the
Management Planning and Development Committee (the ‘‘Committee’’) of our Board oversees our
compensation program. We discuss the roles of the Committee’s independent compensation consultant
and management in the compensation process and describe how we determine each element of
compensation. The CD&A also discusses how we set the challenging performance goals for our annual
incentive bonuses. We believe that our compensation program in 2010 and in prior years shows that we
have closely linked pay to performance.
Executive Summary
Overview of 2010 Performance
As we stated last year, the power of YUM is in our ability to deliver consistently strong results. That is
why we are pleased to report that for 2010 we:
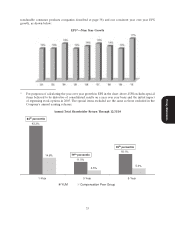
• Achieved record year over year growth in Earnings Per Share (excluding special items) (‘‘EPS’’)
growth of 17%—marking the ninth consecutive year that we exceeded our annual target of at least
10%
• Increased worldwide system sales by 4% (prior to foreign currency translation)
• Opened nearly 1,400 new restaurants outside the United States—the tenth straight year we have
opened more than 1,000 new units
Proxy Statement
• Improved our worldwide restaurant margins by 1.3 percentage points
• Grew operating profits by 15% prior to special items and foreign currency translation
• Generated $1.16 billion in net income—a new high
• Generated almost $2 billion of cash from operations
• Maintained our Return on Invested Capital of over 20%—continuing to be an industry leader
• Increased our dividend by 19%
Our overall performance proved once again the resilience of our global portfolio of leading brands to
deliver consistent double digit EPS growth. Our shareholders also benefited from our strong year as our
stock price increased from $35.38 to $49.66 during fiscal 2010—a return of 40% (excluding dividends).
Overview of Our Compensation Program
For 2010, the compensation program for the Company’s NEOs is essentially the same program that
has been in place for over 10 years. The program is a highly performance based program and the
compensation of our executives reflects the Company’s performance.
Our goal is to provide an executive compensation program that best serves the long-term interests of
our shareholders. The Committee designed our compensation program to support our vision to be the
Defining Global Company That Feeds the World, to enable our major growth strategies and to attract,
30