Pizza Hut 2010 Annual Report Download - page 132
Download and view the complete annual report
Please find page 132 of the 2010 Pizza Hut annual report below. You can navigate through the pages in the report by either clicking on the pages listed below, or by using the keyword search tool below to find specific information within the annual report.-
 1
1 -
2
-
3
-
4
-
5
-
6
-
7
-
8
-
9
-
10
-
11
-
12
-
13
-
14
-
15
-
16
-
17
-
18
-
19
-
20
-
21
-
22
-
23
-
24
-
25
-
26
-
27
-
28
-
29
-
30
-
31
-
32
-
33
-
34
-
35
-
36
-
37
-
38
-
39
-
40
-
41
-
42
-
43
-
44
-
45
-
46
-
47
-
48
-
49
-
50
-
51
-
52
-
53
-
54
-
55
-
56
-
57
-
58
-
59
-
60
-
61
-
62
-
63
-
64
-
65
-
66
-
67
-
68
-
69
-
70
-
71
-
72
-
73
-
74
-
75
-
76
-
77
-
78
-
79
-
80
-
81
-
82
-
83
-
84
-
85
-
86
-
87
-
88
-
89
-
90
-
91
-
92
-
93
-
94
-
95
-
96
-
97
-
98
-
99
-
100
-
101
-
102
-
103
-
104
-
105
-
106
-
107
-
108
-
109
-
110
-
111
-
112
-
113
-
114
-
115
-
116
-
117
-
118
-
119
-
120
-
121
-
 122
122 -
 123
123 -
 124
124 -
 125
125 -
 126
126 -
 127
127 -
 128
128 -
 129
129 -
 130
130 -
 131
131 -
 132
132 -
 133
133 -
 134
134 -
 135
135 -
 136
136 -
 137
137 -
 138
138 -
 139
139 -
 140
140 -
 141
141 -
 142
142 -
143
-
144
-
145
-
146
-
147
-
148
-
149
-
150
-
151
-
152
-
153
-
154
-
155
-
156
-
157
-
158
-
159
-
160
-
161
-
162
-
163
-
164
-
165
-
166
-
167
-
168
-
169
-
170
-
171
-
172
-
173
-
174
-
175
-
176
-
177
-
178
-
179
-
180
-
181
-
182
-
183
-
184
-
185
-
186
-
187
-
188
-
189
-
190
-
191
-
192
-
193
-
194
-
195
-
196
-
197
-
198
-
199
-
200
-
201
-
202
-
203
-
204
-
205
-
206
-
207
-
208
-
209
-
210
-
211
-
212
-
213
-
214
-
215
-
216
-
217
-
218
-
219
-
220
-
221
-
222
-
223
-
224
-
225
-
226
-
227
-
228
-
229
-
230
-
231
-
232
-
233
-
234
-
235
-
236
 |
 |

35
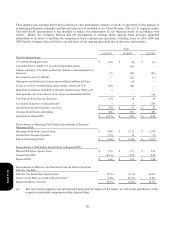
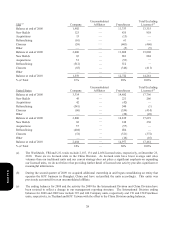
The following table summarizes the impact of refranchising on Total revenues as described above:
2010
China
Division YRI U.S. Worldwide
Decreased Company sales
$
(20
)
$
(183
)
$
(401
)
$
(604
)
Increased Franchise and license fees and income 3 9 25 37
Decrease in Total revenues
$
(17
)
$
(174
)
$
(376)
$
(567
)
The following table summarizes the impact of refranchising on Operating Profit as described above:
2010
China
Division YRI U.S. Worldwide
Decreased Restaurant profit
$
(3
)
$
(5
)
$
(44
)
$
(52
)
Increased Franchise and license fees and income 3 9 25 37
Decreased G&A
—
9 6 15
Increase (decrease) in Operating Profit
$
—
$
13
$
(13
)
$
—
2009
China
Division YRI U.S. Worldwide
Decreased Company sales
$
(5
)
$
(77
)
$
(640)
$
(722
)
Increased Franchise and license fees and income
—
5 36 41
Decrease in Total revenues
$
(5
)
$
(72
)
$
(604
)
$
(681
)
2009
China
Division YRI U.S. Worldwide
Decreased Restaurant profit
$
(1
)
$
(2
)
$
(63
)
$
(66
)
Increased Franchise and license fees and income
—
53641
Decreased G&A
—
—
14 14
Increase (decrease) in Operating Profit
$
(1
)
$
3
$
(13
)
$
(11
)
Form 10-K