Pizza Hut 2010 Annual Report Download - page 209
Download and view the complete annual report
Please find page 209 of the 2010 Pizza Hut annual report below. You can navigate through the pages in the report by either clicking on the pages listed below, or by using the keyword search tool below to find specific information within the annual report.-
 1
1 -
2
-
3
-
4
-
5
-
6
-
7
-
8
-
9
-
10
-
11
-
12
-
13
-
14
-
15
-
16
-
17
-
18
-
19
-
20
-
21
-
22
-
23
-
24
-
25
-
26
-
27
-
28
-
29
-
30
-
31
-
32
-
33
-
34
-
35
-
36
-
37
-
38
-
39
-
40
-
41
-
42
-
43
-
44
-
45
-
46
-
47
-
48
-
49
-
50
-
51
-
52
-
53
-
54
-
55
-
56
-
57
-
58
-
59
-
60
-
61
-
62
-
63
-
64
-
65
-
66
-
67
-
68
-
69
-
70
-
71
-
72
-
73
-
74
-
75
-
76
-
77
-
78
-
79
-
80
-
81
-
82
-
83
-
84
-
85
-
86
-
87
-
88
-
89
-
90
-
91
-
92
-
93
-
94
-
95
-
96
-
97
-
98
-
99
-
100
-
101
-
102
-
103
-
104
-
105
-
106
-
107
-
108
-
109
-
110
-
111
-
112
-
113
-
114
-
115
-
116
-
117
-
118
-
119
-
120
-
121
-
122
-
123
-
124
-
125
-
126
-
127
-
128
-
129
-
130
-
131
-
132
-
133
-
134
-
135
-
136
-
137
-
138
-
139
-
140
-
141
-
142
-
143
-
144
-
145
-
146
-
147
-
148
-
149
-
150
-
151
-
152
-
153
-
154
-
155
-
156
-
157
-
158
-
159
-
160
-
161
-
162
-
163
-
164
-
165
-
166
-
167
-
168
-
169
-
170
-
171
-
172
-
173
-
174
-
175
-
176
-
177
-
178
-
179
-
180
-
181
-
182
-
183
-
184
-
185
-
186
-
187
-
188
-
189
-
190
-
191
-
192
-
193
-
194
-
195
-
196
-
197
-
198
-
 199
199 -
 200
200 -
 201
201 -
 202
202 -
 203
203 -
 204
204 -
 205
205 -
 206
206 -
 207
207 -
 208
208 -
 209
209 -
 210
210 -
 211
211 -
 212
212 -
 213
213 -
 214
214 -
 215
215 -
 216
216 -
 217
217 -
 218
218 -
 219
219 -
220
-
221
-
222
-
223
-
224
-
225
-
226
-
227
-
228
-
229
-
230
-
231
-
232
-
233
-
234
-
235
-
236
 |
 |

112
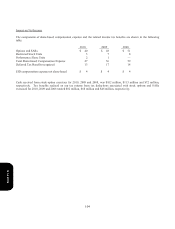
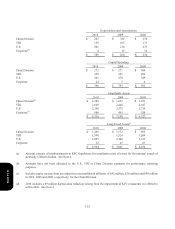
Depreciation and Amortization
2010 2009 2008
China Division $ 225 $ 184 $ 136
YRI 159 165 173
U.S. 201 216 231
Corporate(d) 415 16
$ 589 $ 580 $ 556
Capital Spending
2010 2009 2008
China Division $ 272 $ 271 $ 300
YRI 259 251 280
U.S. 241 270 349
Corporate 24 5 6
$ 796 $ 797 $ 935
Iden
t
ifiable Assets
2010 2009 2008
China Division(h) $2
,
289 $ 1
,
632 $ 1
,
251
YRI 2,649 2,448 2,017
U.S. 2,398 2,575 2,739
Cor
p
orate(i) 980 493 520
$8
,
316 $ 7
,
148 $ 6
,
527
Lon
g
-Lived Assets(j)
2010 2009 2008
China Division $1
,
269 $ 1
,
172 $ 905
YRI 1,548 1,524 1,269
U.S. 2,095 2,260 2,413
Cor
p
orate 52 45 63
$4
,
964 $ 5
,
001 $ 4
,
650
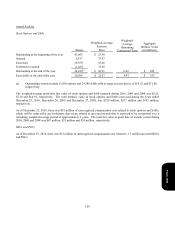
(a)
A
mount consists of reimbursements to KFC franchisees for installation costs of ovens for the national launch of
K
entucky Grilled Chicken. See Note 4.
(b)
A
mounts have not been allocated to the U.S., YRI or China Division segments for performance reporting
p
urposes.
(c)
I
ncludes equity income from investments in unconsolidated affiliates of $42 million, $36 million and $40 million
i
n 2010, 2009 and 2008, respectively, for the China Division.
(d)
2
010 includes a $9 million depreciation reduction arising from the impairment of KFC restaurants we offered to
s
ell in 2010. See Note 4.
Form 10-K