Pizza Hut 2010 Annual Report Download - page 62
Download and view the complete annual report
Please find page 62 of the 2010 Pizza Hut annual report below. You can navigate through the pages in the report by either clicking on the pages listed below, or by using the keyword search tool below to find specific information within the annual report.-
 1
1 -
2
-
3
-
4
-
5
-
6
-
7
-
8
-
9
-
10
-
11
-
12
-
13
-
14
-
15
-
16
-
17
-
18
-
19
-
20
-
21
-
22
-
23
-
24
-
25
-
26
-
27
-
28
-
29
-
30
-
31
-
32
-
33
-
34
-
35
-
36
-
37
-
38
-
39
-
40
-
41
-
42
-
43
-
44
-
45
-
46
-
47
-
48
-
49
-
50
-
51
-
 52
52 -
 53
53 -
 54
54 -
 55
55 -
 56
56 -
 57
57 -
 58
58 -
 59
59 -
 60
60 -
 61
61 -
 62
62 -
 63
63 -
 64
64 -
 65
65 -
 66
66 -
 67
67 -
 68
68 -
 69
69 -
 70
70 -
 71
71 -
 72
72 -
73
-
74
-
75
-
76
-
77
-
78
-
79
-
80
-
81
-
82
-
83
-
84
-
85
-
86
-
87
-
88
-
89
-
90
-
91
-
92
-
93
-
94
-
95
-
96
-
97
-
98
-
99
-
100
-
101
-
102
-
103
-
104
-
105
-
106
-
107
-
108
-
109
-
110
-
111
-
112
-
113
-
114
-
115
-
116
-
117
-
118
-
119
-
120
-
121
-
122
-
123
-
124
-
125
-
126
-
127
-
128
-
129
-
130
-
131
-
132
-
133
-
134
-
135
-
136
-
137
-
138
-
139
-
140
-
141
-
142
-
143
-
144
-
145
-
146
-
147
-
148
-
149
-
150
-
151
-
152
-
153
-
154
-
155
-
156
-
157
-
158
-
159
-
160
-
161
-
162
-
163
-
164
-
165
-
166
-
167
-
168
-
169
-
170
-
171
-
172
-
173
-
174
-
175
-
176
-
177
-
178
-
179
-
180
-
181
-
182
-
183
-
184
-
185
-
186
-
187
-
188
-
189
-
190
-
191
-
192
-
193
-
194
-
195
-
196
-
197
-
198
-
199
-
200
-
201
-
202
-
203
-
204
-
205
-
206
-
207
-
208
-
209
-
210
-
211
-
212
-
213
-
214
-
215
-
216
-
217
-
218
-
219
-
220
-
221
-
222
-
223
-
224
-
225
-
226
-
227
-
228
-
229
-
230
-
231
-
232
-
233
-
234
-
235
-
236
 |
 |

9MAR201101381779
Long-term Incentive Compensation
The principal purpose of our long-term incentive compensation program (‘‘LTI Plan’’) is to motivate
our executives to help us achieve our long-range performance goals that will enhance our value and, as a
result, enhance our shareholders’ returns on their investments.
Under our LTI Plan, our executive officers are awarded long-term incentives in the form of
non-qualified stock options or stock settled stock appreciation rights (‘‘SARs’’). The type of award granted
is based upon the executives’ local tax jurisdiction. Each year the Committee reviews the mix of long-term
incentives to determine if it is appropriate to continue predominantly using stock options and SARs as the
long-term incentive vehicle. The Committee has chosen to use stock options and SARs because they
emphasize YUM’s focus on long-term growth, they reward employees only if the stock price goes up and
they align Restaurant General Managers and senior management on the same equity incentive program.
Long-term incentive award ranges are established based upon the peer group data. In general, our stock
options and SARs have ten-year terms and vest 25% per year over four years.
For each NEO other than Mr. Novak, the 2010 Stock Option/SARs grant was awarded based on the
Committee’s subjective assessment of each executive’s prior year individual and team performance,
expected contribution in future years and consideration of the peer group data, subject to the individual’s
achievement of his stock ownership guidelines. The Committee did not assign a weight to any particular
item.
Based on this assessment of 2009 performance, Messrs. Carucci, Su and Allan received stock
appreciation rights grants above the 50th percentile. Mr. Bergren received a stock appreciation rights grant
below the 50th percentile. Each SAR and stock option was granted with an exercise price based on the
closing market price of the underlying YUM common stock on the date of grant. The Committee does not
measure or review the actual percentile above or below the 50th percentile when making its final LTI award
decision. In addition, the Committee does not measure or review the percentile ranking of the value
realized from any LTI award. Realized value is a function of the performance of the Company common
stock and the length of time a participant holds an award after vesting.
In March 2009, the Committee modified our long-term incentive compensation for our CEO, Chief
Proxy Statement
Financial Officer and our division leaders who report to our CEO by adding a Performance Share Plan and
discontinuing the executives’ participation in the matching restricted stock unit program under the
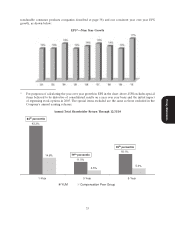
Executive Income Deferral Plan. The Performance Share Plan will distribute a number of shares of
Company common stock based on the 3 year compound annual growth rate (‘‘CAGR’’) of the Company’s
EPS adjusted to exclude special items believed to be distortive of consolidated results on a year over year
basis. The target grant value was set based on a value equal to 33% of the NEO’s annual bonus target. This
amount was designed to equal the value of the discontinued Company match on deferral of their annual
cash incentive into Company common stock. The Committee continued the Performance Share Plan for
2010 for each NEO. The performance period covers 2010-2012 fiscal years and will be leveraged up or
down based on the 3-year CAGR EPS performance against a target of 10%. The payout leverage is
0 - 200% of the target grant value with no payout if CAGR EPS is less than 7% and a 200% payout if
CAGR EPS is at or above 16%. Dividend equivalents will accrue during the performance cycle but will be
distributed in shares only in the same proportion and at the same time as the original PSUs are earned. If
no PSUs are earned, no dividend equivalents will be paid. The PSUs are eligible for deferral under the
Executive Income Deferral Plan. The target, threshold and maximum potential value of these awards are
described at page 52.
During 2010, the Committee approved a retention award for Mr. Su. This award was in recognition of
Mr. Su’s contributions over the preceding twelve years in leading the China division to very strong and
sustained growth and performance and to help ensure his continued leadership. The retention award was a
grant of 171,448 restricted stock units. The award vests after five years and had a grant date economic
value of $7 million. The award will be paid to Mr. Su in shares of YUM common stock twelve months
43