Pizza Hut 2010 Annual Report Download - page 51
Download and view the complete annual report
Please find page 51 of the 2010 Pizza Hut annual report below. You can navigate through the pages in the report by either clicking on the pages listed below, or by using the keyword search tool below to find specific information within the annual report.-
 1
1 -
2
-
3
-
4
-
5
-
6
-
7
-
8
-
9
-
10
-
11
-
12
-
13
-
14
-
15
-
16
-
17
-
18
-
19
-
20
-
21
-
22
-
23
-
24
-
25
-
26
-
27
-
28
-
29
-
30
-
31
-
32
-
33
-
34
-
35
-
36
-
37
-
38
-
39
-
40
-
 41
41 -
 42
42 -
 43
43 -
 44
44 -
 45
45 -
 46
46 -
 47
47 -
 48
48 -
 49
49 -
 50
50 -
 51
51 -
 52
52 -
 53
53 -
 54
54 -
 55
55 -
 56
56 -
 57
57 -
 58
58 -
 59
59 -
 60
60 -
 61
61 -
62
-
63
-
64
-
65
-
66
-
67
-
68
-
69
-
70
-
71
-
72
-
73
-
74
-
75
-
76
-
77
-
78
-
79
-
80
-
81
-
82
-
83
-
84
-
85
-
86
-
87
-
88
-
89
-
90
-
91
-
92
-
93
-
94
-
95
-
96
-
97
-
98
-
99
-
100
-
101
-
102
-
103
-
104
-
105
-
106
-
107
-
108
-
109
-
110
-
111
-
112
-
113
-
114
-
115
-
116
-
117
-
118
-
119
-
120
-
121
-
122
-
123
-
124
-
125
-
126
-
127
-
128
-
129
-
130
-
131
-
132
-
133
-
134
-
135
-
136
-
137
-
138
-
139
-
140
-
141
-
142
-
143
-
144
-
145
-
146
-
147
-
148
-
149
-
150
-
151
-
152
-
153
-
154
-
155
-
156
-
157
-
158
-
159
-
160
-
161
-
162
-
163
-
164
-
165
-
166
-
167
-
168
-
169
-
170
-
171
-
172
-
173
-
174
-
175
-
176
-
177
-
178
-
179
-
180
-
181
-
182
-
183
-
184
-
185
-
186
-
187
-
188
-
189
-
190
-
191
-
192
-
193
-
194
-
195
-
196
-
197
-
198
-
199
-
200
-
201
-
202
-
203
-
204
-
205
-
206
-
207
-
208
-
209
-
210
-
211
-
212
-
213
-
214
-
215
-
216
-
217
-
218
-
219
-
220
-
221
-
222
-
223
-
224
-
225
-
226
-
227
-
228
-
229
-
230
-
231
-
232
-
233
-
234
-
235
-
236
 |
 |

14MAR201107295096
14MAR201107295253
9MAR201101440694
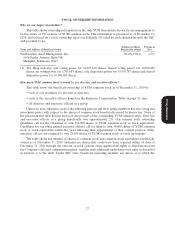
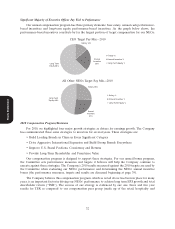
Significant Majority of Executive Officer Pay Tied to Performance
Our annual compensation program has three primary elements: base salary, annual cash performance-
based incentives and long-term equity performance-based incentives. As the graph below shows, the
performance-based incentives constitute by far the largest portion of target compensation for our NEOs:
CEO Target Pay Mix—2010
Salary 14%
Annual
Incentive
23%
Long Term
Equity 63%
Salary %
Annual Incentive %
Long Term Equity %
All Other NEOs Target Pay Mix—2010
Salary 26%
Salary %
Annual Incentive %
Long Term Equity %
Annual
Incentive
27%
Long Term
Equity 48%
Proxy Statement
2010 Compensation Program/Decisions
For 2010, we highlighted four major growth strategies as drivers for earnings growth. The Company
has communicated these same strategies to investors for several years. These strategies are:
• Build Leading Brands in China in Every Significant Category
• Drive Aggressive International Expansion and Build Strong Brands Everywhere
• Improve U.S. Brand Positions, Consistency and Returns
• Provide Long-Term Shareholder and Franchisee Value
Our compensation program is designed to support these strategies. For our annual bonus program,
the Committee sets performance measures and targets it believes will help the Company continue to
execute against these strategies. The Company’s 2010 results measured against the 2010 targets are used by
the Committee when evaluating our NEOs’ performance and determining the NEOs’ annual incentive
bonus (the performance measures, targets and results are discussed beginning at page 39).
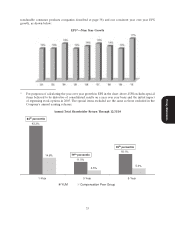
The Company believes this compensation program, which as noted above has been in place for many
years, is an important factor in driving our NEOs’ performance to achieve long term EPS growth and total
shareholder return (‘‘TSR’’). The success of our strategy is evidenced by our one, three and five year
results for TSR as compared to our compensation peer group (made up of the retail, hospitality and
32