Pizza Hut 2010 Annual Report Download - page 130
Download and view the complete annual report
Please find page 130 of the 2010 Pizza Hut annual report below. You can navigate through the pages in the report by either clicking on the pages listed below, or by using the keyword search tool below to find specific information within the annual report.-
 1
1 -
2
-
3
-
4
-
5
-
6
-
7
-
8
-
9
-
10
-
11
-
12
-
13
-
14
-
15
-
16
-
17
-
18
-
19
-
20
-
21
-
22
-
23
-
24
-
25
-
26
-
27
-
28
-
29
-
30
-
31
-
32
-
33
-
34
-
35
-
36
-
37
-
38
-
39
-
40
-
41
-
42
-
43
-
44
-
45
-
46
-
47
-
48
-
49
-
50
-
51
-
52
-
53
-
54
-
55
-
56
-
57
-
58
-
59
-
60
-
61
-
62
-
63
-
64
-
65
-
66
-
67
-
68
-
69
-
70
-
71
-
72
-
73
-
74
-
75
-
76
-
77
-
78
-
79
-
80
-
81
-
82
-
83
-
84
-
85
-
86
-
87
-
88
-
89
-
90
-
91
-
92
-
93
-
94
-
95
-
96
-
97
-
98
-
99
-
100
-
101
-
102
-
103
-
104
-
105
-
106
-
107
-
108
-
109
-
110
-
111
-
112
-
113
-
114
-
115
-
116
-
117
-
118
-
119
-
 120
120 -
 121
121 -
 122
122 -
 123
123 -
 124
124 -
 125
125 -
 126
126 -
 127
127 -
 128
128 -
 129
129 -
 130
130 -
 131
131 -
 132
132 -
 133
133 -
 134
134 -
 135
135 -
 136
136 -
 137
137 -
 138
138 -
 139
139 -
 140
140 -
141
-
142
-
143
-
144
-
145
-
146
-
147
-
148
-
149
-
150
-
151
-
152
-
153
-
154
-
155
-
156
-
157
-
158
-
159
-
160
-
161
-
162
-
163
-
164
-
165
-
166
-
167
-
168
-
169
-
170
-
171
-
172
-
173
-
174
-
175
-
176
-
177
-
178
-
179
-
180
-
181
-
182
-
183
-
184
-
185
-
186
-
187
-
188
-
189
-
190
-
191
-
192
-
193
-
194
-
195
-
196
-
197
-
198
-
199
-
200
-
201
-
202
-
203
-
204
-
205
-
206
-
207
-
208
-
209
-
210
-
211
-
212
-
213
-
214
-
215
-
216
-
217
-
218
-
219
-
220
-
221
-
222
-
223
-
224
-
225
-
226
-
227
-
228
-
229
-
230
-
231
-
232
-
233
-
234
-
235
-
236
 |
 |

33
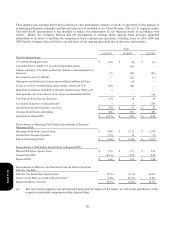
Under the equity method of accounting, we previously reported our 51% share of the net income of the unconsolidated
affiliate (after interest expense and income taxes) as Other (income) expense in the Consolidated Statements of Income.
We also recorded a franchise fee for the royalty received from the stores owned by the unconsolidated affiliate.
Subsequent to the date of the acquisition, we reported the results of operations for the entity in the appropriate line items
of our Consolidated Statements of Income. We no longer recorded franchise fee income for these restaurants nor did we
report Other (income) expense as we did under the equity method of accounting. Net income attributable to our partner’s
ownership percentage is recorded as Net Income-noncontrolling interest within our Consolidated Statements of Income.
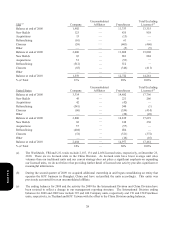
For the year ended December 25, 2010 the consolidation of the existing restaurants upon acquisition increased Company
sales by $98 million, decreased Franchise and license fees and income by $6 million and positively impacted Operating
Profit by $3 million. For the year ended December 26, 2009 the consolidation of the existing restaurants upon acquisition
increased Company sales by $192 million; decreased Franchise and license fees and income by $12 million and positively
impacted Operating Profit by $4 million. The impact on Net Income – YUM! Brands, Inc. was not significant to the years
ended December 25, 2010 and December 26, 2009.
Sale of our Interest in our Unconsolidated Affiliate in Japan
During the year ended December 27, 2008 we recorded a pre-tax gain of approximately $100 million related to the sale of
our interest in our unconsolidated affiliate in Japan (See Note 4 for further discussion of this transaction). This gain was
recorded in Other (income) expense in our Consolidated Statement of Income and was not allocated to any segment for
performance reporting purposes.
Russia Acquisition
On July 1, 2010, we completed the exercise of our option with our Russian partner to purchase their interest in the co-
branded Rostik’s-KFC restaurants across Russia and the Commonwealth of Independent States. As a result, we acquired
company ownership of 50 restaurants and gained full rights and responsibilities as franchisor of 81 restaurants, which our
partner previously managed as master franchisee. Upon exercise of our option, we paid cash of $56 million, net of
settlement of a long-term note receivable of $11 million, and assumed long-term debt of $10 million. The remaining
balance of the purchase price, anticipated to be $11 million, will be paid in cash in July 2012. As a result of our
preliminary purchase price allocation for this acquisition, our Consolidated Balance Sheet includes $36 million of
goodwill and $36 million of identifiable intangibles at December 25, 2010. The impact of consolidating this business on
all line items within our Consolidated Statement of Income was insignificant for the year ended December 25, 2010.
Pizza Hut South Korea Goodwill Impairment
As a result of a decline in future profit expectations for our Pizza Hut South Korea market we recorded a goodwill
impairment charge of $12 million for this market during 2009. This charge was recorded in Closure and impairment
(income) expenses in our Consolidated Statement of Income and was allocated to our International Division for
performance reporting purposes.
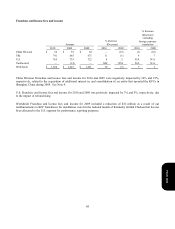
Store Portfolio Strategy
From time to time we sell Company restaurants to existing and new franchisees where geographic synergies can be
obtained or where franchisees’ expertise can generally be leveraged to improve our overall operating performance, while
retaining Company ownership of strategic U.S. and international markets in which we choose to continue investing
capital. In the U.S., we are targeting Company ownership of KFC, Pizza Hut and Taco Bell restaurants of about 12%,
down from its current level of 15%. This U.S. target ownership percentage no longer considers the impact of LJS and
A&W restaurants, both of which are completely franchise operated, as we are pursuing a sale of these brands. Consistent
with this strategy, 404, 541 and 700 Company restaurants in the U.S. were sold to franchisees in the years ended
December 25, 2010, December 26, 2009 and December 27, 2008, respectively, and at December 25, 2010 we have offered
for refranchising approximately 550 KFCs in the U.S. During 2010, we also executed refranchising of all Company
owned KFCs and Pizza Huts in Mexico (345 restaurants) and KFCs in Taiwan (124 restaurants).
Form 10-K