Pizza Hut 2010 Annual Report Download - page 53
Download and view the complete annual report
Please find page 53 of the 2010 Pizza Hut annual report below. You can navigate through the pages in the report by either clicking on the pages listed below, or by using the keyword search tool below to find specific information within the annual report.-
 1
1 -
2
-
3
-
4
-
5
-
6
-
7
-
8
-
9
-
10
-
11
-
12
-
13
-
14
-
15
-
16
-
17
-
18
-
19
-
20
-
21
-
22
-
23
-
24
-
25
-
26
-
27
-
28
-
29
-
30
-
31
-
32
-
33
-
34
-
35
-
36
-
37
-
38
-
39
-
40
-
41
-
42
-
 43
43 -
 44
44 -
 45
45 -
 46
46 -
 47
47 -
 48
48 -
 49
49 -
 50
50 -
 51
51 -
 52
52 -
 53
53 -
 54
54 -
 55
55 -
 56
56 -
 57
57 -
 58
58 -
 59
59 -
 60
60 -
 61
61 -
 62
62 -
 63
63 -
64
-
65
-
66
-
67
-
68
-
69
-
70
-
71
-
72
-
73
-
74
-
75
-
76
-
77
-
78
-
79
-
80
-
81
-
82
-
83
-
84
-
85
-
86
-
87
-
88
-
89
-
90
-
91
-
92
-
93
-
94
-
95
-
96
-
97
-
98
-
99
-
100
-
101
-
102
-
103
-
104
-
105
-
106
-
107
-
108
-
109
-
110
-
111
-
112
-
113
-
114
-
115
-
116
-
117
-
118
-
119
-
120
-
121
-
122
-
123
-
124
-
125
-
126
-
127
-
128
-
129
-
130
-
131
-
132
-
133
-
134
-
135
-
136
-
137
-
138
-
139
-
140
-
141
-
142
-
143
-
144
-
145
-
146
-
147
-
148
-
149
-
150
-
151
-
152
-
153
-
154
-
155
-
156
-
157
-
158
-
159
-
160
-
161
-
162
-
163
-
164
-
165
-
166
-
167
-
168
-
169
-
170
-
171
-
172
-
173
-
174
-
175
-
176
-
177
-
178
-
179
-
180
-
181
-
182
-
183
-
184
-
185
-
186
-
187
-
188
-
189
-
190
-
191
-
192
-
193
-
194
-
195
-
196
-
197
-
198
-
199
-
200
-
201
-
202
-
203
-
204
-
205
-
206
-
207
-
208
-
209
-
210
-
211
-
212
-
213
-
214
-
215
-
216
-
217
-
218
-
219
-
220
-
221
-
222
-
223
-
224
-
225
-
226
-
227
-
228
-
229
-
230
-
231
-
232
-
233
-
234
-
235
-
236
 |
 |

9MAR201101440694
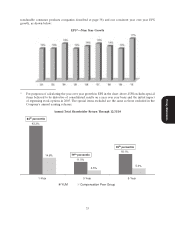
As shown above, the percentile ranking of our performance measured by TSR is in the top quartile for
each of the three time periods. A substantial reason for this superior performance is our track record of
consistency in delivering strong, year-over-year growth in EPS. In light of the Company’s strong
performance during 2010, as well as its sustained performance over the years, the Committee believes that
the program’s stated objective of paying our Chief Executive Officer at the 75th percentile and our other
NEOs at the 75th percentile for salary and annual bonus and the 50th percentile for equity-based
compensation has helped attract and retain top talent and has incentivized that talent to a high level of
performance.
In line with our pay for performance policy, we took the following 2010 compensation actions:
•No Adjustments to Base Salary: Based on general economic conditions in 2009, we believed base
salaries should not be increased for 2010;
•Pay-for-Performance Annual Incentive: Based on our strong 2010 performance, we paid bonuses for
2010 recognizing our strong operating profit growth (prior to special items and foreign currency
translation) and strong EPS growth and for meeting the other division and individual performance
goals set by the Committee for fiscal 2010; and
•Equity-based Compensation: In line with our growth strategy and to align NEOs with shareholder
interests, we granted SARs or stock options to our NEOs based on each NEO’s performance. We
also granted PSUs that will vest only if we achieve pre-established 3-year EPS growth goals.
In the remainder of the CD&A, we discuss in more detail our executive compensation program and
how it worked in 2010. Among other topics, we address the following:
• The philosophy underlying our executive compensation program (page 35)
• The objectives of our executive compensation program (page 35)
• An overview of the key elements of our executive compensation program (page 35)
• The process the Management Planning and Development Committee (‘‘Committee’’) uses to set
and review executive compensation (page 36)
Proxy Statement
• The alignment of our executive compensation with the Company’s business and financial
performance (page 36)
• The allocation between fixed and variable compensation (page 36)
• The role of our independent compensation consultant (page 36)
• The role of comparative compensation data and how we select the companies that are used to
generate the comparative data (page 37)
• Compensation decisions for NEOs other than our CEO (beginning at page 38) including:
• Team performance measures, which are used in the calculation of the annual bonus (page 39)
• Individual performance measures, which are also used in the calculation of the annual bonus
(page 39)
• Our CEO’s compensation (page 44)
• Our stock ownership guidelines (page 47)
34