Pizza Hut 2010 Annual Report Download - page 141
Download and view the complete annual report
Please find page 141 of the 2010 Pizza Hut annual report below. You can navigate through the pages in the report by either clicking on the pages listed below, or by using the keyword search tool below to find specific information within the annual report.-
 1
1 -
2
-
3
-
4
-
5
-
6
-
7
-
8
-
9
-
10
-
11
-
12
-
13
-
14
-
15
-
16
-
17
-
18
-
19
-
20
-
21
-
22
-
23
-
24
-
25
-
26
-
27
-
28
-
29
-
30
-
31
-
32
-
33
-
34
-
35
-
36
-
37
-
38
-
39
-
40
-
41
-
42
-
43
-
44
-
45
-
46
-
47
-
48
-
49
-
50
-
51
-
52
-
53
-
54
-
55
-
56
-
57
-
58
-
59
-
60
-
61
-
62
-
63
-
64
-
65
-
66
-
67
-
68
-
69
-
70
-
71
-
72
-
73
-
74
-
75
-
76
-
77
-
78
-
79
-
80
-
81
-
82
-
83
-
84
-
85
-
86
-
87
-
88
-
89
-
90
-
91
-
92
-
93
-
94
-
95
-
96
-
97
-
98
-
99
-
100
-
101
-
102
-
103
-
104
-
105
-
106
-
107
-
108
-
109
-
110
-
111
-
112
-
113
-
114
-
115
-
116
-
117
-
118
-
119
-
120
-
121
-
122
-
123
-
124
-
125
-
126
-
127
-
128
-
129
-
130
-
 131
131 -
 132
132 -
 133
133 -
 134
134 -
 135
135 -
 136
136 -
 137
137 -
 138
138 -
 139
139 -
 140
140 -
 141
141 -
 142
142 -
 143
143 -
 144
144 -
 145
145 -
 146
146 -
 147
147 -
 148
148 -
 149
149 -
 150
150 -
 151
151 -
152
-
153
-
154
-
155
-
156
-
157
-
158
-
159
-
160
-
161
-
162
-
163
-
164
-
165
-
166
-
167
-
168
-
169
-
170
-
171
-
172
-
173
-
174
-
175
-
176
-
177
-
178
-
179
-
180
-
181
-
182
-
183
-
184
-
185
-
186
-
187
-
188
-
189
-
190
-
191
-
192
-
193
-
194
-
195
-
196
-
197
-
198
-
199
-
200
-
201
-
202
-
203
-
204
-
205
-
206
-
207
-
208
-
209
-
210
-
211
-
212
-
213
-
214
-
215
-
216
-
217
-
218
-
219
-
220
-
221
-
222
-
223
-
224
-
225
-
226
-
227
-
228
-
229
-
230
-
231
-
232
-
233
-
234
-
235
-
236
 |
 |

44
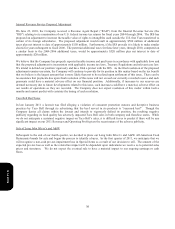
General and Administrative Expenses
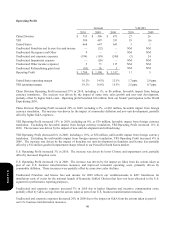
The increase in China Division G&A expenses for 2010 and 2009, excluding the impact of foreign currency translation,
was driven by increased compensation costs resulting from higher headcount and the impact of the consolidation of a
former unconsolidated affiliate during 2009 (See Note 4 for further discussion).
The increase in YRI G&A expenses for 2010, excluding the impact of foreign currency translation, was driven by
increased investment in strategic growth markets, including costs related to the Russia acquisition (See Note 4 for further
discussion), partially offset by G&A savings from refranchising all of our remaining company restaurants in Taiwan.
In 2009, the increase in YRI G&A expenses, excluding the impact of foreign currency translation, was driven by
increased investment in strategic growth markets.
The increase in U.S. G&A expenses for 2010 was driven by increased litigation and incentive compensation costs,
partially offset by G&A savings from the actions taken as part of our U.S. business transformation measures and lower
project spending.
The increase in Unallocated G&A expenses for 2010 was driven by increased litigation and incentive compensation costs,
partially offset by G&A savings from the actions taken as part of our U.S. business transformation measures.
In 2009, the decreases in U.S. and Unallocated G&A expenses were driven by the impact on G&A from the actions taken
as part of our U.S. business transformation measures.
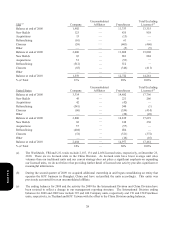
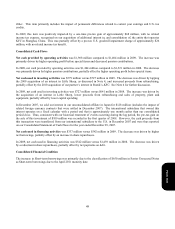
Worldwide Franchise and License Expenses
Franchise and license expenses decreased 7% in 2010. The decrease was driven by lower provision for U.S. past due
receivables (primarily at KFC and Pizza Hut) and lapping 2009 international franchise convention costs.
Franchise and license expenses increased 19% in 2009. The increase was driven by quality control initiatives, increased
provision for U.S. past due receivables (primarily at KFC and LJS) and higher international franchise convention costs.
Amount
% Increase
(Decrease)
% Increase
(Decrease)
excluding
foreign currency
translation
2010 2009 2008 2010 2009 2010 2009
China Division
$
216
$
188 $165 15 13 15 12
YRI 378 362 392 4(7
)
13
U.S. 492 482 547 2(12
)
N/A N/A
Unallocated 191 189 238 1(21
)
N/A N/A
Worldwide
$
1,277
$
1,221
$
1,342 5(9
)
3(6
)
Form 10-K