Pizza Hut 2010 Annual Report Download - page 163
Download and view the complete annual report
Please find page 163 of the 2010 Pizza Hut annual report below. You can navigate through the pages in the report by either clicking on the pages listed below, or by using the keyword search tool below to find specific information within the annual report.-
 1
1 -
2
-
3
-
4
-
5
-
6
-
7
-
8
-
9
-
10
-
11
-
12
-
13
-
14
-
15
-
16
-
17
-
18
-
19
-
20
-
21
-
22
-
23
-
24
-
25
-
26
-
27
-
28
-
29
-
30
-
31
-
32
-
33
-
34
-
35
-
36
-
37
-
38
-
39
-
40
-
41
-
42
-
43
-
44
-
45
-
46
-
47
-
48
-
49
-
50
-
51
-
52
-
53
-
54
-
55
-
56
-
57
-
58
-
59
-
60
-
61
-
62
-
63
-
64
-
65
-
66
-
67
-
68
-
69
-
70
-
71
-
72
-
73
-
74
-
75
-
76
-
77
-
78
-
79
-
80
-
81
-
82
-
83
-
84
-
85
-
86
-
87
-
88
-
89
-
90
-
91
-
92
-
93
-
94
-
95
-
96
-
97
-
98
-
99
-
100
-
101
-
102
-
103
-
104
-
105
-
106
-
107
-
108
-
109
-
110
-
111
-
112
-
113
-
114
-
115
-
116
-
117
-
118
-
119
-
120
-
121
-
122
-
123
-
124
-
125
-
126
-
127
-
128
-
129
-
130
-
131
-
132
-
133
-
134
-
135
-
136
-
137
-
138
-
139
-
140
-
141
-
142
-
143
-
144
-
145
-
146
-
147
-
148
-
149
-
150
-
151
-
152
-
 153
153 -
 154
154 -
 155
155 -
 156
156 -
 157
157 -
 158
158 -
 159
159 -
 160
160 -
 161
161 -
 162
162 -
 163
163 -
 164
164 -
 165
165 -
 166
166 -
 167
167 -
 168
168 -
 169
169 -
 170
170 -
 171
171 -
 172
172 -
 173
173 -
174
-
175
-
176
-
177
-
178
-
179
-
180
-
181
-
182
-
183
-
184
-
185
-
186
-
187
-
188
-
189
-
190
-
191
-
192
-
193
-
194
-
195
-
196
-
197
-
198
-
199
-
200
-
201
-
202
-
203
-
204
-
205
-
206
-
207
-
208
-
209
-
210
-
211
-
212
-
213
-
214
-
215
-
216
-
217
-
218
-
219
-
220
-
221
-
222
-
223
-
224
-
225
-
226
-
227
-
228
-
229
-
230
-
231
-
232
-
233
-
234
-
235
-
236
 |
 |

66
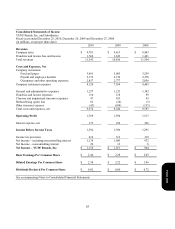
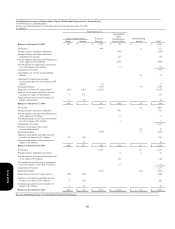
Consolidated Statements of Shareholders’ Equity (Deficit) and Comprehensive Income (Loss)
YUM! Brands, Inc. and Subsidiaries
Fiscal years ended December 25, 2010, December 26, 2009 and December 27, 2008
(in millions)
Yum! Brands, Inc.
Issued Common Stock
Retained
Accumulated
Other
Com
p
rehensive
Noncontrolling
Shares Amoun
t
Earnings Income(Loss) Interest Total
Balance at December 29
,
2007 499 $
—
$ 1,119 $ 20 $ — $ 1
,
139
Net Income 964 8 972
Forei
g
n currenc
y
translation ad
j
ustment (198 )
(
198)
Foreign currency translation adjustment
included in Net Income (25 ) (25)
Pension and post-retirement benefit plans (net
of tax im
p
act of $114 million
)
(208 )
(208)
Net unrealized loss on derivative instruments
(
net of tax im
p
act of $4 million
)
(7 )
(7)
Com
p
rehensive Income 53
4
Consolidation of a former unconsolidated
affiliate 12
12
Adjustment to change pension plans
measurement dates (net of tax impact of $4
million) (7) (7)
Dividends declared (339) (6)
(
345)
Re
p
urchase of shares of Common Stoc
k
(47) (181) (1,434)
(
1
,
615)
Employee stock option and SARs exercises
(
includes tax im
p
act of $40 million
)
6 112
112
Compensation-related events (includes tax
impact of $6 million) 1 76
7
6
Balance at December 27, 2008 459 $ 7 $ 303 $ (418 ) $ 14 $ (94)
Net Income 1,071 12 1,083
Forei
g
n currenc
y
translation ad
j
ustment 176 17
6
Pension and post-retirement benefit plans (net
of tax im
p
act of $9 million
)
13
13
Net unrealized gain on derivative instruments
(
net of tax im
p
act of $3 million
)
5
5
Com
p
rehensive Income 1,277
Purchase of subsidiary shares from
noncontrollin
g
interest 70 7
0
Dividends declared (378) (7)
(
385)
Employee stock option and SARs exercises
(includes tax impact of $57 million) 10 168
168
Compensation-related events (includes tax
im
p
act of $2 million
)
—
78
78
Balance at December 26, 2009 469 $ 253 $ 996 $ (224 ) $ 89 $ 1,11
4
Net Income 1,158 20 1,178
Foreign currency translation adjustment 8 4 12
Pension and post-retirement benefit plans (net
of tax impact of $7 million) (10 ) (10)
Net unrealized loss on derivative instruments
(net of tax impact of less than $1 million) (1) (1)
Comprehensive Income 1,179
Dividends declared (437) (20 ) (457)
Repurchase of shares of Common Stock (10) (390) (39
0
)
Employee stock option and SARs exercises
(includes tax impact of $73 million) 9 168 168
Compensation-related events (includes tax
impact of $7 million) 1 55 55
Balance at December 25, 2010 469 $ 86 $ 1,717 $ (227 ) $ 93 $ 1,669
See accompanying Notes to Consolidated Financial Statements.
Form 10-K