Pizza Hut 2010 Annual Report Download - page 145
Download and view the complete annual report
Please find page 145 of the 2010 Pizza Hut annual report below. You can navigate through the pages in the report by either clicking on the pages listed below, or by using the keyword search tool below to find specific information within the annual report.-
 1
1 -
2
-
3
-
4
-
5
-
6
-
7
-
8
-
9
-
10
-
11
-
12
-
13
-
14
-
15
-
16
-
17
-
18
-
19
-
20
-
21
-
22
-
23
-
24
-
25
-
26
-
27
-
28
-
29
-
30
-
31
-
32
-
33
-
34
-
35
-
36
-
37
-
38
-
39
-
40
-
41
-
42
-
43
-
44
-
45
-
46
-
47
-
48
-
49
-
50
-
51
-
52
-
53
-
54
-
55
-
56
-
57
-
58
-
59
-
60
-
61
-
62
-
63
-
64
-
65
-
66
-
67
-
68
-
69
-
70
-
71
-
72
-
73
-
74
-
75
-
76
-
77
-
78
-
79
-
80
-
81
-
82
-
83
-
84
-
85
-
86
-
87
-
88
-
89
-
90
-
91
-
92
-
93
-
94
-
95
-
96
-
97
-
98
-
99
-
100
-
101
-
102
-
103
-
104
-
105
-
106
-
107
-
108
-
109
-
110
-
111
-
112
-
113
-
114
-
115
-
116
-
117
-
118
-
119
-
120
-
121
-
122
-
123
-
124
-
125
-
126
-
127
-
128
-
129
-
130
-
131
-
132
-
133
-
134
-
 135
135 -
 136
136 -
 137
137 -
 138
138 -
 139
139 -
 140
140 -
 141
141 -
 142
142 -
 143
143 -
 144
144 -
 145
145 -
 146
146 -
 147
147 -
 148
148 -
 149
149 -
 150
150 -
 151
151 -
 152
152 -
 153
153 -
 154
154 -
 155
155 -
156
-
157
-
158
-
159
-
160
-
161
-
162
-
163
-
164
-
165
-
166
-
167
-
168
-
169
-
170
-
171
-
172
-
173
-
174
-
175
-
176
-
177
-
178
-
179
-
180
-
181
-
182
-
183
-
184
-
185
-
186
-
187
-
188
-
189
-
190
-
191
-
192
-
193
-
194
-
195
-
196
-
197
-
198
-
199
-
200
-
201
-
202
-
203
-
204
-
205
-
206
-
207
-
208
-
209
-
210
-
211
-
212
-
213
-
214
-
215
-
216
-
217
-
218
-
219
-
220
-
221
-
222
-
223
-
224
-
225
-
226
-
227
-
228
-
229
-
230
-
231
-
232
-
233
-
234
-
235
-
236
 |
 |

48
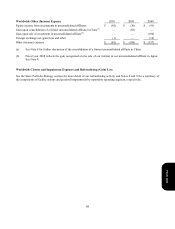
In 2009, the benefit was negatively impacted by withholding taxes associated with the distribution of intercompany
dividends that were only partially offset by related foreign tax credits generated during the year.
In 2008, the benefit was positively impacted by the recognition of deferred tax assets for the net operating losses
generated by tax planning actions implemented in 2008 (1.7 percentage points). In addition, the benefit was also
favorably impacted by a decrease in tax expense for certain foreign markets.
Adjustments to reserves and prior years. This item includes: (1) the effects of reconciling income tax amounts recorded
in our Consolidated Statements of Income to amounts reflected on our tax returns, including any adjustments to the
Consolidated Balance Sheets; and (2) changes in tax reserves, including interest thereon, established for potential
exposure we may incur if a taxing authority takes a position on a matter contrary to our position. We evaluate these
amounts on a quarterly basis to insure that they have been appropriately adjusted for audit settlements and other events we
believe may impact the outcome. The impact of certain effects or changes may offset items reflected in the ‘Statutory rate
differential attributable to foreign operations’ line.
In 2010, this item included a net increase in tax expense driven by the reversal of foreign tax credits for prior years that
are not likely to be claimed on future tax returns.
In 2009, this item included out-of-year adjustments which lowered our effective tax rate by 1.6 percentage points.
In 2008, this item included out-of-year adjustments which increased our effective tax rate by 1.8 percentage points.
Change in valuation allowance. This item relates to changes for deferred tax assets generated or utilized during the
current year and changes in our judgment regarding the likelihood of using deferred tax assets that existed at the
beginning of the year. The impact of certain changes may offset items reflected in the ‘Statutory rate differential
attributable to foreign operations’ line.
In 2010, the $22 million of net tax expense was driven by $25 million for valuation allowances recorded against deferred
tax assets generated during the current year. This expense was partially offset by a $3 million tax benefit resulting from a
change in judgment regarding the future use of U.S. state deferred tax assets that existed at the beginning of the year.
In 2009, the $9 million net tax benefit was driven by $25 million of benefit resulting from a change in judgment regarding
the future use of foreign deferred tax assets that existed at the beginning of the year. This benefit was partially offset by
$16 million for valuation allowances recorded against deferred tax assets generated during the year.
In 2008, the $12 million net tax expense was primarily due to $42 million for valuation allowances recorded against
deferred tax assets generated during the year, including a full valuation allowance provided on deferred tax assets for net
operating losses generated by tax planning actions as we did not believe it was more likely than not that they would be
realized in the future. This increase was partially offset by $30 million of benefits primarily resulting from a change in
judgment regarding the future use of foreign deferred tax assets that existed at the beginning of the year.
Form 10-K