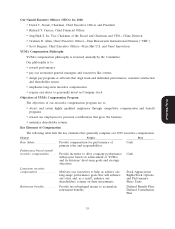
Pizza Hut 2010 Annual Report Download - page 59
Download and view the complete annual report
Please find page 59 of the 2010 Pizza Hut annual report below. You can navigate through the pages in the report by either clicking on the pages listed below, or by using the keyword search tool below to find specific information within the annual report.-
 1
1 -
2
-
3
-
4
-
5
-
6
-
7
-
8
-
9
-
10
-
11
-
12
-
13
-
14
-
15
-
16
-
17
-
18
-
19
-
20
-
21
-
22
-
23
-
24
-
25
-
26
-
27
-
28
-
29
-
30
-
31
-
32
-
33
-
34
-
35
-
36
-
37
-
38
-
39
-
40
-
41
-
42
-
43
-
44
-
45
-
46
-
47
-
48
-
 49
49 -
 50
50 -
 51
51 -
 52
52 -
 53
53 -
 54
54 -
 55
55 -
 56
56 -
 57
57 -
 58
58 -
 59
59 -
 60
60 -
 61
61 -
 62
62 -
 63
63 -
 64
64 -
 65
65 -
 66
66 -
 67
67 -
 68
68 -
 69
69 -
70
-
71
-
72
-
73
-
74
-
75
-
76
-
77
-
78
-
79
-
80
-
81
-
82
-
83
-
84
-
85
-
86
-
87
-
88
-
89
-
90
-
91
-
92
-
93
-
94
-
95
-
96
-
97
-
98
-
99
-
100
-
101
-
102
-
103
-
104
-
105
-
106
-
107
-
108
-
109
-
110
-
111
-
112
-
113
-
114
-
115
-
116
-
117
-
118
-
119
-
120
-
121
-
122
-
123
-
124
-
125
-
126
-
127
-
128
-
129
-
130
-
131
-
132
-
133
-
134
-
135
-
136
-
137
-
138
-
139
-
140
-
141
-
142
-
143
-
144
-
145
-
146
-
147
-
148
-
149
-
150
-
151
-
152
-
153
-
154
-
155
-
156
-
157
-
158
-
159
-
160
-
161
-
162
-
163
-
164
-
165
-
166
-
167
-
168
-
169
-
170
-
171
-
172
-
173
-
174
-
175
-
176
-
177
-
178
-
179
-
180
-
181
-
182
-
183
-
184
-
185
-
186
-
187
-
188
-
189
-
190
-
191
-
192
-
193
-
194
-
195
-
196
-
197
-
198
-
199
-
200
-
201
-
202
-
203
-
204
-
205
-
206
-
207
-
208
-
209
-
210
-
211
-
212
-
213
-
214
-
215
-
216
-
217
-
218
-
219
-
220
-
221
-
222
-
223
-
224
-
225
-
226
-
227
-
228
-
229
-
230
-
231
-
232
-
233
-
234
-
235
-
236
 |
 |

9MAR201101440694
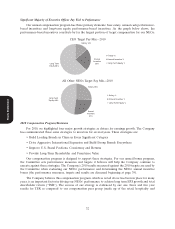
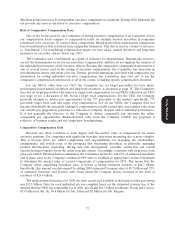
salaries determined the threshold, target and maximum awards potential under the program for 2010,
which are reported in dollars in the Grants of Plan-Based Awards table on page 55.
A detailed description of how team and individual performance factors are determined and measured
can be found below under the heading ‘‘Performance Factors.’’
Annual Target Bonus Percentage. The ‘‘Annual Target Bonus Percentage’’ for each NEO for 2010 was:
Novak Carucci Allan Su Bergren
160% 95% 115% 115% 85%
The Committee noted the 2010 target bonus opportunities, when compared to the survey data, were
slightly above the 75th percentile for Messrs. Su and Allan, at the 75th percentile for Mr. Carucci and
slightly below the 75th percentile for Mr. Bergren. Consistent with prior years, the Committee did not
consider the actual percentile above or below the 75th percentile when making its final bonus decisions.
Rather, it considered the overall strong performance of the Company and the current and expected
performance of each of these NEOs in the growth of the Company and it determined that it was
appropriate to continue target bonuses at or slightly above the 75th percentile. Mr. Novak’s performance is
discussed beginning on page 44.
Performance Factors. To determine the performance factors for each NEO, the Committee reviews
actual performance against pre-established consolidated operating Company measures and targets (‘‘Team
Performance Factor’’) and individual performance measures and targets (‘‘Individual Performance
Factor’’).
Team Performance Factor. For 2010, the Committee determined each executive’s team performance
measures and team performance targets, based on recommendations from management. Consistent with
prior years, the Committee established the business team performance measures, targets and relative
weights in January 2010 and reviewed actual performance against these measures and targets as set forth in
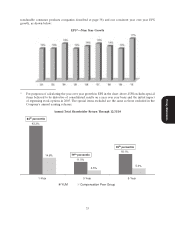
the chart below for the NEOs. The targets were developed through the Company’s annual financial
planning process, in which we assessed historical performance, the future operating environment and
profit growth initiatives and built projections of anticipated results. These projections include profit growth
Proxy Statement
to achieve our EPS growth target of at least 10%. Division targets may be adjusted during the year when
doing so is consistent with the objectives and intent at the time the targets were originally set. In 2010,
some division operating profit growth targets were adjusted to reflect certain YUM approved investments
and restaurant divestitures not reflective of annual operating performance.
We believe these performance measures and targets are key factors that drive individual and team
performance, which will result in increased shareholder value over the long term. These measures are
designed to align employee goals with the Company’s individual divisions’ current year objectives to grow
earnings and sales, develop new restaurants, improve margins and increase customer satisfaction and in the
case of our CEO and CFO align them with the Company-wide EPS target and all divisions’ objectives and
performance. The measures also serve as effective motivation because they are easy to track and clearly
understood by employees. When setting targets for each specific team performance measure, the Company
takes into account overall business goals and structures the target to motivate achievement of desired
performance consistent with broader shareholder commitments such as EPS growth, ROIC and cash flow.
The targets are the same as those that we disclose from time to time to our investors and may be slightly
above or below disclosed guidance when determined by our Committee to be appropriate. A leverage
formula for each team performance measure magnifies the potential impact that performance above or
below the target will have on the calculation of annual incentive compensation. This leverage increases the
financial incentive for employees to exceed their targets and reduces payouts when the team performance
measure is not reached.
The team performance targets, actual team performance, team performance weights and team
performance factor for each measure are set forth below for the NEOs.
40