Pizza Hut 2010 Annual Report Download - page 63
Download and view the complete annual report
Please find page 63 of the 2010 Pizza Hut annual report below. You can navigate through the pages in the report by either clicking on the pages listed below, or by using the keyword search tool below to find specific information within the annual report.-
 1
1 -
2
-
3
-
4
-
5
-
6
-
7
-
8
-
9
-
10
-
11
-
12
-
13
-
14
-
15
-
16
-
17
-
18
-
19
-
20
-
21
-
22
-
23
-
24
-
25
-
26
-
27
-
28
-
29
-
30
-
31
-
32
-
33
-
34
-
35
-
36
-
37
-
38
-
39
-
40
-
41
-
42
-
43
-
44
-
45
-
46
-
47
-
48
-
49
-
50
-
51
-
52
-
 53
53 -
 54
54 -
 55
55 -
 56
56 -
 57
57 -
 58
58 -
 59
59 -
 60
60 -
 61
61 -
 62
62 -
 63
63 -
 64
64 -
 65
65 -
 66
66 -
 67
67 -
 68
68 -
 69
69 -
 70
70 -
 71
71 -
 72
72 -
 73
73 -
74
-
75
-
76
-
77
-
78
-
79
-
80
-
81
-
82
-
83
-
84
-
85
-
86
-
87
-
88
-
89
-
90
-
91
-
92
-
93
-
94
-
95
-
96
-
97
-
98
-
99
-
100
-
101
-
102
-
103
-
104
-
105
-
106
-
107
-
108
-
109
-
110
-
111
-
112
-
113
-
114
-
115
-
116
-
117
-
118
-
119
-
120
-
121
-
122
-
123
-
124
-
125
-
126
-
127
-
128
-
129
-
130
-
131
-
132
-
133
-
134
-
135
-
136
-
137
-
138
-
139
-
140
-
141
-
142
-
143
-
144
-
145
-
146
-
147
-
148
-
149
-
150
-
151
-
152
-
153
-
154
-
155
-
156
-
157
-
158
-
159
-
160
-
161
-
162
-
163
-
164
-
165
-
166
-
167
-
168
-
169
-
170
-
171
-
172
-
173
-
174
-
175
-
176
-
177
-
178
-
179
-
180
-
181
-
182
-
183
-
184
-
185
-
186
-
187
-
188
-
189
-
190
-
191
-
192
-
193
-
194
-
195
-
196
-
197
-
198
-
199
-
200
-
201
-
202
-
203
-
204
-
205
-
206
-
207
-
208
-
209
-
210
-
211
-
212
-
213
-
214
-
215
-
216
-
217
-
218
-
219
-
220
-
221
-
222
-
223
-
224
-
225
-
226
-
227
-
228
-
229
-
230
-
231
-
232
-
233
-
234
-
235
-
236
 |
 |

9MAR201101440694
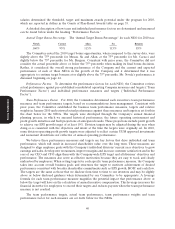
following his retirement provided that he does not leave the Company before the award vests. Since this
award was intended as an incentive to retain Mr. Su for at least five more years and as special recognition
of China Division’s contribution to the Company’s performance, it was not considered by the Committee in
determining Mr. Su’s 2010 compensation.
Mr. Novak’s long-term incentive compensation is discussed below.
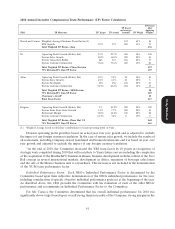
How we Compensate our Chief Executive Officer
Comparative Compensation Data for Mr. Novak
The discussion of the comparative compensation data and peer group used by the Committee for
Mr. Novak begins at page 38. Meridian provided a comprehensive review for the Committee using data
from the peer group.
Mr. Novak’s Compensation
Each year, our Board, under the leadership of the Committee Chairperson, conducts an evaluation of
the performance of our CEO, David Novak. This evaluation includes a review of his:
• leadership pertaining to the achievement of business results
• leadership in the development and implementation of Company strategies
• development of culture, diversity and talent management
In setting compensation opportunities for 2010, the Committee considered the historical performance
of the Company for the one, five and ten year periods, noting that Mr. Novak has been CEO for that entire
period and Chairman since 2001. The data revealed that the Company had on average performed very
strongly compared to the nondurable consumer products peer group in terms of total shareholder return
(top quartile for the five and ten year periods), return on net assets (top quartile), EPS growth (top 50%
for the one and five year periods) and operating income growth (top 50%). Based on this continued
sustained strong performance, the Committee determined that Mr. Novak’s target total compensation for
2010 should be at or slightly below the 75th percentile as compared to the compensation of chief executives
Proxy Statement
in the peer group.
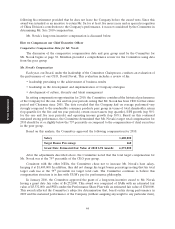
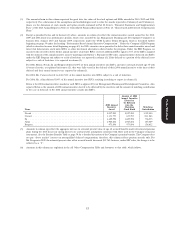
Based on this analysis, the Committee approved the following compensation for 2010:
Salary 1,400,000
Target Bonus Percentage 160
Grant Date Estimated Fair Value of 2010 LTI Awards: 6,272,000
After the adjustments described above, the Committee noted that the total target compensation for
Mr. Novak was at the 75th percentile of the CEO peer group.
Consistent with the other NEOs, the Committee chose not to increase Mr. Novak’s base salary,
keeping it at $1,400,000. In addition, they did not change his target bonus percentage noting that his total
target cash was at the 75th percentile for target total cash. The Committee continues to believe this
compensation structure is in line with YUM’s pay for performance philosophy.
In January 2010, the Committee approved the grant of a long-term incentive award to Mr. Novak
having a grant date fair value of $6,272,000. This award was comprised of SARs with an estimated fair
value of $5,532,000, and PSUs under the Performance Share Plan with an estimated fair value of $740,000.
This award reflected the Committee’s subjective determination that, based on his strong performance in
2009 and the sustained performance of the Company (without assigning any weight to any particular item),
44