Pizza Hut 2010 Annual Report Download - page 182
Download and view the complete annual report
Please find page 182 of the 2010 Pizza Hut annual report below. You can navigate through the pages in the report by either clicking on the pages listed below, or by using the keyword search tool below to find specific information within the annual report.-
 1
1 -
 2
2 -
 3
3 -
 4
4 -
 5
5 -
 6
6 -
 7
7 -
 8
8 -
 9
9 -
 10
10 -
 11
11 -
 12
12 -
 13
13 -
 14
14 -
 15
15 -
 16
16 -
 17
17 -
 18
18 -
 19
19 -
 20
20 -
 21
21 -
 22
22 -
 23
23 -
 24
24 -
 25
25 -
 26
26 -
 27
27 -
 28
28 -
 29
29 -
 30
30 -
 31
31 -
 32
32 -
 33
33 -
 34
34 -
 35
35 -
 36
36 -
 37
37 -
 38
38 -
 39
39 -
 40
40 -
 41
41 -
 42
42 -
 43
43 -
 44
44 -
 45
45 -
 46
46 -
 47
47 -
 48
48 -
 49
49 -
 50
50 -
 51
51 -
 52
52 -
 53
53 -
 54
54 -
 55
55 -
 56
56 -
 57
57 -
 58
58 -
 59
59 -
 60
60 -
 61
61 -
 62
62 -
 63
63 -
 64
64 -
 65
65 -
 66
66 -
 67
67 -
 68
68 -
 69
69 -
 70
70 -
 71
71 -
 72
72 -
 73
73 -
 74
74 -
 75
75 -
 76
76 -
 77
77 -
 78
78 -
 79
79 -
 80
80 -
 81
81 -
 82
82 -
 83
83 -
 84
84 -
 85
85 -
 86
86 -
 87
87 -
 88
88 -
 89
89 -
 90
90 -
 91
91 -
 92
92 -
 93
93 -
 94
94 -
 95
95 -
 96
96 -
 97
97 -
 98
98 -
 99
99 -
 100
100 -
 101
101 -
 102
102 -
 103
103 -
 104
104 -
 105
105 -
 106
106 -
 107
107 -
 108
108 -
 109
109 -
 110
110 -
 111
111 -
 112
112 -
 113
113 -
 114
114 -
 115
115 -
 116
116 -
 117
117 -
 118
118 -
 119
119 -
 120
120 -
 121
121 -
 122
122 -
 123
123 -
 124
124 -
 125
125 -
 126
126 -
 127
127 -
 128
128 -
 129
129 -
 130
130 -
 131
131 -
 132
132 -
 133
133 -
 134
134 -
 135
135 -
 136
136 -
 137
137 -
 138
138 -
 139
139 -
 140
140 -
 141
141 -
 142
142 -
 143
143 -
 144
144 -
 145
145 -
 146
146 -
 147
147 -
 148
148 -
 149
149 -
 150
150 -
 151
151 -
 152
152 -
 153
153 -
 154
154 -
 155
155 -
 156
156 -
 157
157 -
 158
158 -
 159
159 -
 160
160 -
 161
161 -
 162
162 -
 163
163 -
 164
164 -
 165
165 -
 166
166 -
 167
167 -
 168
168 -
 169
169 -
 170
170 -
 171
171 -
 172
172 -
 173
173 -
 174
174 -
 175
175 -
 176
176 -
 177
177 -
 178
178 -
 179
179 -
 180
180 -
 181
181 -
 182
182 -
 183
183 -
 184
184 -
 185
185 -
 186
186 -
 187
187 -
 188
188 -
 189
189 -
 190
190 -
 191
191 -
 192
192 -
 193
193 -
 194
194 -
 195
195 -
 196
196 -
 197
197 -
 198
198 -
 199
199 -
 200
200 -
 201
201 -
 202
202 -
 203
203 -
 204
204 -
 205
205 -
 206
206 -
 207
207 -
 208
208 -
 209
209 -
 210
210 -
 211
211 -
 212
212 -
 213
213 -
 214
214 -
 215
215 -
 216
216 -
 217
217 -
 218
218 -
 219
219 -
 220
220 -
 221
221 -
 222
222 -
 223
223 -
 224
224 -
 225
225 -
 226
226 -
 227
227 -
 228
228 -
 229
229 -
 230
230 -
 231
231 -
 232
232 -
 233
233 -
 234
234 -
 235
235 -
 236
236
 |
 |

85
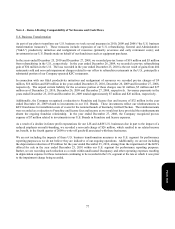
Note 9 – Goodwill and Intangible Assets
The changes in the carrying amount of goodwill are as follows:
China
Division YRI U.S. Worldwide
Balance as of December 27, 2008
Goodwill, gross $ 30 $ 224 $ 356 $ 610
Accumulated impairment losses
—
(5
)
—
(5
)
Goodwill, net 30 219 356 605
Acquisitions 52
—
154
Impairment losses(a) (b)
—
(12
)
(26
)
(38
)
Disposals and other, net(c)
—
25 (5
)
19
Balance as of December 26, 2009
Goodwill, gross 82 249 352 683
Accumulated impairment losses
—
(17
)
(26
)
(43
)
Goodwill, net 82 232 326 640
Acquisitions(d)
—
37
—
37
Disposals and other, net(c) 3(17
)
(4
)
(18
)
Balance as of December 25, 2010
Goodwill, gross 85 269 348 702
Accumulated impairment losses
—
(17) (26
)
(43
)
Goodwill, net
$
85
$
252
$
322
$
659
(a) We recorded a non-cash goodwill impairment charge of $26 million, which resulted in no related tax benefit,
associated with our LJS and A&W-U.S. reporting unit in the fourth quarter of 2009 as the carrying value of this
reporting unit exceeded its fair value. The fair value of the reporting unit was based on our discounted
expected after-tax cash flows from the future royalty stream, net of G&A, expected to be earned from the
underlying franchise agreements. These cash flows incorporated the decline in future profit expectations for
our LJS and A&W-U.S. reporting unit which were due in part to the impact of a reduced emphasis on multi-
branding as a U.S. growth strategy. This charge was recorded in Closure and impairment (income) expenses in
our Consolidated Statement of Income and was not allocated to the U.S. segment for performance reporting
purposes. See Note 4.
(b) We recorded a non-cash goodwill impairment charge of $12 million for our Pizza Hut South Korea reporting
unit in the fourth quarter of 2009 as the carrying value of this reporting unit exceeded its fair value. The fair
value of this reporting unit was based on the discounted expected after-tax cash flows from company operations
and franchise royalties for the business. Our expectations of future cash flows were negatively impacted by
recent profit declines the business has experienced. This charge was recorded in Closure and impairment
(income) expenses in our Consolidated Statement of Income and was allocated to our International segment for
performance reporting purposes.
Form 10-K
