Pizza Hut 2010 Annual Report Download - page 147
Download and view the complete annual report
Please find page 147 of the 2010 Pizza Hut annual report below. You can navigate through the pages in the report by either clicking on the pages listed below, or by using the keyword search tool below to find specific information within the annual report.-
 1
1 -
2
-
3
-
4
-
5
-
6
-
7
-
8
-
9
-
10
-
11
-
12
-
13
-
14
-
15
-
16
-
17
-
18
-
19
-
20
-
21
-
22
-
23
-
24
-
25
-
26
-
27
-
28
-
29
-
30
-
31
-
32
-
33
-
34
-
35
-
36
-
37
-
38
-
39
-
40
-
41
-
42
-
43
-
44
-
45
-
46
-
47
-
48
-
49
-
50
-
51
-
52
-
53
-
54
-
55
-
56
-
57
-
58
-
59
-
60
-
61
-
62
-
63
-
64
-
65
-
66
-
67
-
68
-
69
-
70
-
71
-
72
-
73
-
74
-
75
-
76
-
77
-
78
-
79
-
80
-
81
-
82
-
83
-
84
-
85
-
86
-
87
-
88
-
89
-
90
-
91
-
92
-
93
-
94
-
95
-
96
-
97
-
98
-
99
-
100
-
101
-
102
-
103
-
104
-
105
-
106
-
107
-
108
-
109
-
110
-
111
-
112
-
113
-
114
-
115
-
116
-
117
-
118
-
119
-
120
-
121
-
122
-
123
-
124
-
125
-
126
-
127
-
128
-
129
-
130
-
131
-
132
-
133
-
134
-
135
-
136
-
 137
137 -
 138
138 -
 139
139 -
 140
140 -
 141
141 -
 142
142 -
 143
143 -
 144
144 -
 145
145 -
 146
146 -
 147
147 -
 148
148 -
 149
149 -
 150
150 -
 151
151 -
 152
152 -
 153
153 -
 154
154 -
 155
155 -
 156
156 -
 157
157 -
158
-
159
-
160
-
161
-
162
-
163
-
164
-
165
-
166
-
167
-
168
-
169
-
170
-
171
-
172
-
173
-
174
-
175
-
176
-
177
-
178
-
179
-
180
-
181
-
182
-
183
-
184
-
185
-
186
-
187
-
188
-
189
-
190
-
191
-
192
-
193
-
194
-
195
-
196
-
197
-
198
-
199
-
200
-
201
-
202
-
203
-
204
-
205
-
206
-
207
-
208
-
209
-
210
-
211
-
212
-
213
-
214
-
215
-
216
-
217
-
218
-
219
-
220
-
221
-
222
-
223
-
224
-
225
-
226
-
227
-
228
-
229
-
230
-
231
-
232
-
233
-
234
-
235
-
236
 |
 |

50
Liquidity and Capital Resources
Operating in the QSR industry allows us to generate substantial cash flows from the operations of our company stores and
from our substantial franchise operations which require a limited YUM investment. Net cash provided by operating
activities has exceeded $1 billion in each of the last nine fiscal years, including nearly $2 billion in 2010. We expect these
levels of net cash provided by operating activities to continue in the foreseeable future. However, unforeseen downturns
in our business could adversely impact our cash flows from operations from the levels historically realized.
In the event our cash flows are negatively impacted by business downturns, we believe we have the ability to temporarily
reduce our discretionary spending without significant impact to our long-term business prospects. Our discretionary
spending includes capital spending for new restaurants, acquisitions of restaurants from franchisees, repurchases of shares
of our Common Stock and dividends paid to our shareholders. Additionally, as of December 25, 2010 we had
approximately $1.3 billion in unused capacity under our revolving credit facilities that expire in 2012, primarily related to
a domestic facility.
During the third quarter of 2010, we issued $350 million aggregate principal amount of 3.88% 10 year Senior Unsecured
Notes due to the favorable credit markets. As a result of issuing the Senior Unsecured Notes as well as our continued
strong cash flows from operating activities, we have cash and cash equivalents at December 25, 2010 that are higher than
our historical levels. Our cash equivalents are temporarily invested in short-term investment grade securities with
maturities of three months or less. We anticipate using a significant amount of these cash and cash equivalents when $650
million in Senior Unsecured Notes come due in April 2011.
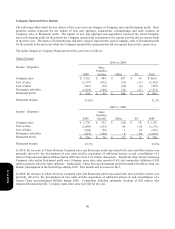
Our China Division and YRI represented more than 65% of the Company’s operating profit in 2010 (excluding Corporate
and unallocated income and expenses) and both generate a significant amount of positive cash flows that we have
historically used to fund our international development. To the extent we have needed to repatriate international cash to
fund our U.S. discretionary cash spending, including share repurchases, dividends and debt repayments, we have
historically been able to do so in a tax efficient manner. As a result of our substantial international development a
significant amount of investments in foreign subsidiaries are essentially permanent in duration as of December 25, 2010.
If we experience an unforeseen decrease in our cash flows from our U.S. business or are unable to refinance future U.S.
debt maturities we may be required to repatriate future international earnings at tax rates higher than we have historically
experienced.
We currently have investment grade ratings from Standard & Poor’s Rating Services (BBB-) and Moody’s Investors
Service (Baa3). While we do not anticipate a downgrade in our credit rating, a downgrade would increase the Company’s
current borrowing costs and could impact the Company’s ability to access the credit markets if necessary. Based on the
amount and composition of our debt at December 25, 2010, which included no borrowings outstanding under our credit
facilities, our interest expense would not materially increase on a full year basis should we receive a one-level downgrade
in our ratings.
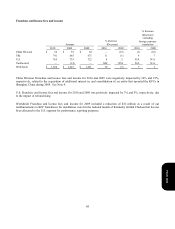
Discretionary Spending
During 2010, we invested $796 million in capital spending, including approximately $265 million in the U.S., $259
million for the International Division and $272 million for the China Division. For 2011, we estimate capital spending
will be approximately $900 million.
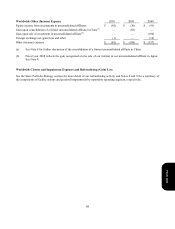
During the year ended December 25, 2010, we repurchased shares for $390 million, which includes the effect of $19
million in share repurchases with trade dates prior to the 2010 fiscal year end but cash settlement dates subsequent to the
2010 fiscal year. In March 2010, our Board of Directors authorized share repurchases through March 2011 of up to $300
million (excluding applicable transaction fees) of our outstanding Common Stock. At December 25, 2010, we had
remaining capacity to repurchase up to approximately $193 million of outstanding Common Stock (excluding applicable
transaction fees) under the March 2010 authorization. Additionally, on January 27, 2011, our Board of Directors
authorized share repurchases through July 2012 of up to $750 million (excluding applicable transaction fees) of our
outstanding Common Stock. Shares are repurchased opportunistically as part of our regular capital structure decisions.
Form 10-K