Pizza Hut 2010 Annual Report Download - page 200
Download and view the complete annual report
Please find page 200 of the 2010 Pizza Hut annual report below. You can navigate through the pages in the report by either clicking on the pages listed below, or by using the keyword search tool below to find specific information within the annual report.-
 1
1 -
2
-
3
-
4
-
5
-
6
-
7
-
8
-
9
-
10
-
11
-
12
-
13
-
14
-
15
-
16
-
17
-
18
-
19
-
20
-
21
-
22
-
23
-
24
-
25
-
26
-
27
-
28
-
29
-
30
-
31
-
32
-
33
-
34
-
35
-
36
-
37
-
38
-
39
-
40
-
41
-
42
-
43
-
44
-
45
-
46
-
47
-
48
-
49
-
50
-
51
-
52
-
53
-
54
-
55
-
56
-
57
-
58
-
59
-
60
-
61
-
62
-
63
-
64
-
65
-
66
-
67
-
68
-
69
-
70
-
71
-
72
-
73
-
74
-
75
-
76
-
77
-
78
-
79
-
80
-
81
-
82
-
83
-
84
-
85
-
86
-
87
-
88
-
89
-
90
-
91
-
92
-
93
-
94
-
95
-
96
-
97
-
98
-
99
-
100
-
101
-
102
-
103
-
104
-
105
-
106
-
107
-
108
-
109
-
110
-
111
-
112
-
113
-
114
-
115
-
116
-
117
-
118
-
119
-
120
-
121
-
122
-
123
-
124
-
125
-
126
-
127
-
128
-
129
-
130
-
131
-
132
-
133
-
134
-
135
-
136
-
137
-
138
-
139
-
140
-
141
-
142
-
143
-
144
-
145
-
146
-
147
-
148
-
149
-
150
-
151
-
152
-
153
-
154
-
155
-
156
-
157
-
158
-
159
-
160
-
161
-
162
-
163
-
164
-
165
-
166
-
167
-
168
-
169
-
170
-
171
-
172
-
173
-
174
-
175
-
176
-
177
-
178
-
179
-
180
-
181
-
182
-
183
-
184
-
185
-
186
-
187
-
188
-
189
-
 190
190 -
 191
191 -
 192
192 -
 193
193 -
 194
194 -
 195
195 -
 196
196 -
 197
197 -
 198
198 -
 199
199 -
 200
200 -
 201
201 -
 202
202 -
 203
203 -
 204
204 -
 205
205 -
 206
206 -
 207
207 -
 208
208 -
 209
209 -
 210
210 -
211
-
212
-
213
-
214
-
215
-
216
-
217
-
218
-
219
-
220
-
221
-
222
-
223
-
224
-
225
-
226
-
227
-
228
-
229
-
230
-
231
-
232
-
233
-
234
-
235
-
236
 |
 |

103
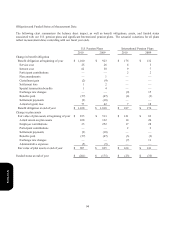
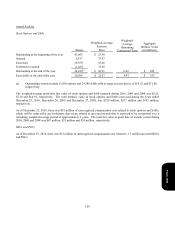
Award Activity
Stock Options and SARs
Shares
W
eighted-Average
Exercise
Price
Weighted-
Average
Remaining
Contractual Term
Aggregate
Intrinsic Value
(in millions)
Outstanding at the beginning of the year 41,665 $ 23.59
Granted 6,197 33.57
Exercised (9,937
)
16.46
Forfeited or expired (1,487
)
31.49
Outstanding at the end of the year 36,438
(
a) $ 26.91 6.02 $ 829
Exercisable at the end of the year 20,504 $ 22.67 4.43 $ 553
(a) Outstanding awards include 12,058 options and 24,380 SARs with average exercise prices of $18.52 and $31.06,
respectively.
The weighted-average grant-date fair value of stock options and SARs granted during 2010, 2009 and 2008 was $8.21,
$7.29 and $10.91, respectively. The total intrinsic value of stock options and SARs exercised during the years ended
December 25, 2010, December 26, 2009 and December 27, 2008, was $259 million, $217 million and $145 million,
respectively.
As of December 25, 2010, there was $81 million of unrecognized compensation cost related to stock options and SARs,
which will be reduced by any forfeitures that occur, related to unvested awards that is expected to be recognized over a
remaining weighted-average period of approximately 2 years. The total fair value at grant date of awards vested during
2010, 2009 and 2008 was $47 million, $52 million and $54 million, respectively.
RSUs and PSUs
As of December 25, 2010, there was $12 million of unrecognized compensation cost related to 1.7 million unvested RSUs
and PSUs.
Form 10-K