Pizza Hut 2010 Annual Report Download - page 144
Download and view the complete annual report
Please find page 144 of the 2010 Pizza Hut annual report below. You can navigate through the pages in the report by either clicking on the pages listed below, or by using the keyword search tool below to find specific information within the annual report.-
 1
1 -
2
-
3
-
4
-
5
-
6
-
7
-
8
-
9
-
10
-
11
-
12
-
13
-
14
-
15
-
16
-
17
-
18
-
19
-
20
-
21
-
22
-
23
-
24
-
25
-
26
-
27
-
28
-
29
-
30
-
31
-
32
-
33
-
34
-
35
-
36
-
37
-
38
-
39
-
40
-
41
-
42
-
43
-
44
-
45
-
46
-
47
-
48
-
49
-
50
-
51
-
52
-
53
-
54
-
55
-
56
-
57
-
58
-
59
-
60
-
61
-
62
-
63
-
64
-
65
-
66
-
67
-
68
-
69
-
70
-
71
-
72
-
73
-
74
-
75
-
76
-
77
-
78
-
79
-
80
-
81
-
82
-
83
-
84
-
85
-
86
-
87
-
88
-
89
-
90
-
91
-
92
-
93
-
94
-
95
-
96
-
97
-
98
-
99
-
100
-
101
-
102
-
103
-
104
-
105
-
106
-
107
-
108
-
109
-
110
-
111
-
112
-
113
-
114
-
115
-
116
-
117
-
118
-
119
-
120
-
121
-
122
-
123
-
124
-
125
-
126
-
127
-
128
-
129
-
130
-
131
-
132
-
133
-
 134
134 -
 135
135 -
 136
136 -
 137
137 -
 138
138 -
 139
139 -
 140
140 -
 141
141 -
 142
142 -
 143
143 -
 144
144 -
 145
145 -
 146
146 -
 147
147 -
 148
148 -
 149
149 -
 150
150 -
 151
151 -
 152
152 -
 153
153 -
 154
154 -
155
-
156
-
157
-
158
-
159
-
160
-
161
-
162
-
163
-
164
-
165
-
166
-
167
-
168
-
169
-
170
-
171
-
172
-
173
-
174
-
175
-
176
-
177
-
178
-
179
-
180
-
181
-
182
-
183
-
184
-
185
-
186
-
187
-
188
-
189
-
190
-
191
-
192
-
193
-
194
-
195
-
196
-
197
-
198
-
199
-
200
-
201
-
202
-
203
-
204
-
205
-
206
-
207
-
208
-
209
-
210
-
211
-
212
-
213
-
214
-
215
-
216
-
217
-
218
-
219
-
220
-
221
-
222
-
223
-
224
-
225
-
226
-
227
-
228
-
229
-
230
-
231
-
232
-
233
-
234
-
235
-
236
 |
 |

47
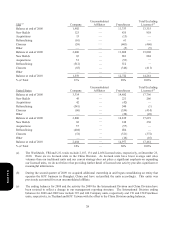
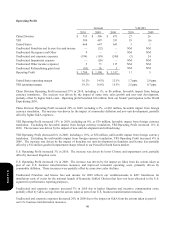
Unallocated impairment expense in 2009 includes a $26 million impairment charge related to LJS/A&W U.S. goodwill.
Unallocated Other income (expense) in 2009 includes a $68 million gain upon acquisition of additional ownership in, and
consolidation of, the entity that operates KFCs in Shanghai, China, and 2008 includes a $100 million gain recognized on
the sale of our interest in our unconsolidated affiliate in Japan. See Note 4 for further discussion.
Unallocated Refranchising gain (loss) in 2010 includes pre-tax non-cash losses of $89 million related to our efforts to
refranchise a substantial portion of our Company operated KFC restaurants in the U.S. and a non-cash loss of $52 million
related to the sale of our Mexico equity business, offset by U.S. gains for restaurants sold at Pizza Hut and Taco Bell. See
Note 4 for further discussion.
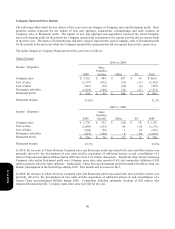
Interest Expense, Net
2010 2009 2008
Interest expense $ 195 $ 212 $ 253
Interest income (20) (18) (27)
Interest expense, net $ 175 $ 194 $ 226
Interest expense, net decreased $19 million or 9% in 2010. This decrease was driven by both a decrease in average net
borrowings and a decline in interest rates on the variable portion of our debt.
Interest expense, net decreased $32 million or 14% in 2009. This decrease was primarily driven by a decline in interest
rates on the variable portion of our debt and a decrease in borrowings in 2009 as compared to 2008.
Income Taxes
The reconciliation of income taxes calculated at the U.S. federal tax statutory rate to our effective tax rate is set forth
below:
2010 2009 2008
U.S. federal statutory rate $ 558 35.0
%
$ 489 35.0% $ 452 35.0%
State income tax, net of federal tax benefit 12 0.7 14 1.0 5 0.6
Statutory rate differential attributable to foreign operations (235) (14.7) (159) (11.4) (187
)
(14.5)
Adjustments to reserves and prior years 55 3.5 (9) (0.6) 44 3.5
Change in valuation allowance 22 1.4 (9) (0.7) 12 0.6
Other, net 4 0.2 (13) (0.9) (7
)
(0.5)
Effective income tax rate $ 416 26.1
%
$ 313 22.4% $ 319 24.7%
Statutory rate differential attributable to foreign operations. This item includes local taxes, withholding taxes, and
shareholder-level taxes, net of foreign tax credits. The favorable impact is primarily attributable to a majority of our
income being earned outside of the U.S. where tax rates are generally lower than the U.S. rate.
In 2010, the benefit was positively impacted by the recognition of excess foreign tax credits generated by our intent to
repatriate current year foreign earnings.
Form 10-K