Pizza Hut 2010 Annual Report Download - page 146
Download and view the complete annual report
Please find page 146 of the 2010 Pizza Hut annual report below. You can navigate through the pages in the report by either clicking on the pages listed below, or by using the keyword search tool below to find specific information within the annual report.-
 1
1 -
2
-
3
-
4
-
5
-
6
-
7
-
8
-
9
-
10
-
11
-
12
-
13
-
14
-
15
-
16
-
17
-
18
-
19
-
20
-
21
-
22
-
23
-
24
-
25
-
26
-
27
-
28
-
29
-
30
-
31
-
32
-
33
-
34
-
35
-
36
-
37
-
38
-
39
-
40
-
41
-
42
-
43
-
44
-
45
-
46
-
47
-
48
-
49
-
50
-
51
-
52
-
53
-
54
-
55
-
56
-
57
-
58
-
59
-
60
-
61
-
62
-
63
-
64
-
65
-
66
-
67
-
68
-
69
-
70
-
71
-
72
-
73
-
74
-
75
-
76
-
77
-
78
-
79
-
80
-
81
-
82
-
83
-
84
-
85
-
86
-
87
-
88
-
89
-
90
-
91
-
92
-
93
-
94
-
95
-
96
-
97
-
98
-
99
-
100
-
101
-
102
-
103
-
104
-
105
-
106
-
107
-
108
-
109
-
110
-
111
-
112
-
113
-
114
-
115
-
116
-
117
-
118
-
119
-
120
-
121
-
122
-
123
-
124
-
125
-
126
-
127
-
128
-
129
-
130
-
131
-
132
-
133
-
134
-
135
-
 136
136 -
 137
137 -
 138
138 -
 139
139 -
 140
140 -
 141
141 -
 142
142 -
 143
143 -
 144
144 -
 145
145 -
 146
146 -
 147
147 -
 148
148 -
 149
149 -
 150
150 -
 151
151 -
 152
152 -
 153
153 -
 154
154 -
 155
155 -
 156
156 -
157
-
158
-
159
-
160
-
161
-
162
-
163
-
164
-
165
-
166
-
167
-
168
-
169
-
170
-
171
-
172
-
173
-
174
-
175
-
176
-
177
-
178
-
179
-
180
-
181
-
182
-
183
-
184
-
185
-
186
-
187
-
188
-
189
-
190
-
191
-
192
-
193
-
194
-
195
-
196
-
197
-
198
-
199
-
200
-
201
-
202
-
203
-
204
-
205
-
206
-
207
-
208
-
209
-
210
-
211
-
212
-
213
-
214
-
215
-
216
-
217
-
218
-
219
-
220
-
221
-
222
-
223
-
224
-
225
-
226
-
227
-
228
-
229
-
230
-
231
-
232
-
233
-
234
-
235
-
236
 |
 |

49
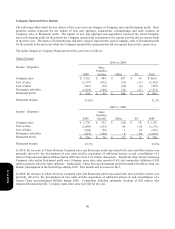
Other. This item primarily includes the impact of permanent differences related to current year earnings and U.S. tax
credits.
In 2009, this item was positively impacted by a one-time pre-tax gain of approximately $68 million, with no related
income tax expense, recognized on our acquisition of additional interest in, and consolidation of, the entity that operates
KFC in Shanghai, China. This was partially offset by a pre-tax U.S. goodwill impairment charge of approximately $26
million, with no related income tax benefit.
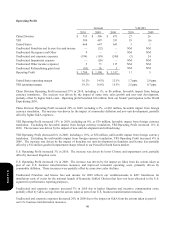
Consolidated Cash Flows
Net cash provided by operating activities was $1,968 million compared to $1,404 million in 2009. The increase was
primarily driven by higher operating profit before special items and decreased pension contributions.
In 2009, net cash provided by operating activities was $1,404 million compared to $1,521 million in 2008. The decrease
was primarily driven by higher pension contributions, partially offset by higher operating profit before special items.
Net cash used in investing activities was $579 million versus $727 million in 2009. The decrease was driven by lapping
the 2009 acquisition of an interest in Little Sheep, as discussed in Note 4, and increased proceeds from refranchising,
partially offset by the 2010 acquisition of our partner’s interest in Rostik’s-KFC. See Note 4 for further discussion.
In 2009, net cash used in investing activities was $727 million versus $641 million in 2008. The increase was driven by
the acquisition of an interest in Little Sheep, lower proceeds from refranchising and sales of property, plant and
equipment, partially offset by lower capital spending.
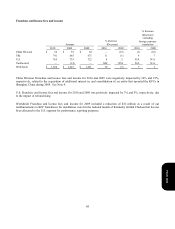
In December 2007, we sold our interest in our unconsolidated affiliate in Japan for $128 million (includes the impact of
related foreign currency contracts that were settled in December 2007). The international subsidiary that owned this
interest operates on a fiscal calendar with a period end that is approximately one month earlier than our consolidated
period close. Thus, consistent with our historical treatment of events occurring during the lag period, the pre-tax gain on
the sale of this investment of $100 million was recorded in the first quarter of 2008. However, the cash proceeds from
this transaction were transferred from our international subsidiary to the U.S. in December 2007 and were thus reported
on our Consolidated Statement of Cash Flows for the year ended December 29, 2007.
Net cash used in financing activities was $337 million versus $542 million in 2009. The decrease was driven by higher
net borrowings, partially offset by an increase in share repurchases.
In 2009, net cash used in financing activities was $542 million versus $1,459 million in 2008. The decrease was driven
by a reduction in share repurchases, partially offset by net payments on debt.
Consolidated Financial Condition
The increase in Short-term borrowings was primarily due to the classification of $650 million in Senior Unsecured Notes
as Short-term borrowings due to the April 2011 maturity date.
Form 10-K