Pizza Hut 2010 Annual Report Download - page 74
Download and view the complete annual report
Please find page 74 of the 2010 Pizza Hut annual report below. You can navigate through the pages in the report by either clicking on the pages listed below, or by using the keyword search tool below to find specific information within the annual report.-
 1
1 -
2
-
3
-
4
-
5
-
6
-
7
-
8
-
9
-
10
-
11
-
12
-
13
-
14
-
15
-
16
-
17
-
18
-
19
-
20
-
21
-
22
-
23
-
24
-
25
-
26
-
27
-
28
-
29
-
30
-
31
-
32
-
33
-
34
-
35
-
36
-
37
-
38
-
39
-
40
-
41
-
42
-
43
-
44
-
45
-
46
-
47
-
48
-
49
-
50
-
51
-
52
-
53
-
54
-
55
-
56
-
57
-
58
-
59
-
60
-
61
-
62
-
63
-
 64
64 -
 65
65 -
 66
66 -
 67
67 -
 68
68 -
 69
69 -
 70
70 -
 71
71 -
 72
72 -
 73
73 -
 74
74 -
 75
75 -
 76
76 -
 77
77 -
 78
78 -
 79
79 -
 80
80 -
 81
81 -
 82
82 -
 83
83 -
 84
84 -
85
-
86
-
87
-
88
-
89
-
90
-
91
-
92
-
93
-
94
-
95
-
96
-
97
-
98
-
99
-
100
-
101
-
102
-
103
-
104
-
105
-
106
-
107
-
108
-
109
-
110
-
111
-
112
-
113
-
114
-
115
-
116
-
117
-
118
-
119
-
120
-
121
-
122
-
123
-
124
-
125
-
126
-
127
-
128
-
129
-
130
-
131
-
132
-
133
-
134
-
135
-
136
-
137
-
138
-
139
-
140
-
141
-
142
-
143
-
144
-
145
-
146
-
147
-
148
-
149
-
150
-
151
-
152
-
153
-
154
-
155
-
156
-
157
-
158
-
159
-
160
-
161
-
162
-
163
-
164
-
165
-
166
-
167
-
168
-
169
-
170
-
171
-
172
-
173
-
174
-
175
-
176
-
177
-
178
-
179
-
180
-
181
-
182
-
183
-
184
-
185
-
186
-
187
-
188
-
189
-
190
-
191
-
192
-
193
-
194
-
195
-
196
-
197
-
198
-
199
-
200
-
201
-
202
-
203
-
204
-
205
-
206
-
207
-
208
-
209
-
210
-
211
-
212
-
213
-
214
-
215
-
216
-
217
-
218
-
219
-
220
-
221
-
222
-
223
-
224
-
225
-
226
-
227
-
228
-
229
-
230
-
231
-
232
-
233
-
234
-
235
-
236
 |
 |

9MAR201101381779
Proxy Statement
55
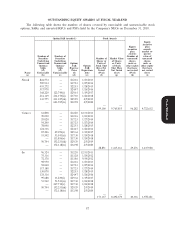
GRANTS OF PLAN-BASED AWARDS
The following table provides information on stock options, SARs, RSUs and PSUs granted for 2010 to each of the Company’s NEOs. The
amount of these awards that were expensed is shown in the Summary Compensation Table at page 52.
All Other
All Other Option/SAR
Stock Awards: Awards: Exercise or
Number of Number of Base Price
Estimated Possible Payouts Under Estimated Future Payouts Under Shares of Securities of
Non-Equity Incentive Plan Awards(1) Equity Incentive Plan Awards(2) Stock Underlying Option/SAR Grant Date
Threshold Target Maximum Threshold Target Maximum or Units Options Awards Fair Value
Name Grant Date ($) ($) ($) (#) (#) (#) (#)(3) (#)(4) ($/Sh)(5) ($)(6)
(a) (b) (c) (d) (e) (f) (g) (h) (i) (j) (k) (l)
Novak 2/5/2010 0 2,240,000 6,720,000
2/5/2010 623,925 32.98 5,029,877
2/5/2010 0 22,438 44,876 740,005
Carucci 2/5/2010 0 679,250 2,037,750
2/5/2010 172,118 32.98 1,387,559
2/5/2010 0 6,823 13,646 225,023
Su 2/5/2010 0 937,250 2,811,750
2/5/2010 172,118 32.98 1,387,559
2/5/2010 0 9,400 18,800 310,012
5/20/2010 171,448 6,796,199
Allan 2/5/2010 0 937,250 2,811,750
2/5/2010 172,118 32.98 1,387,559
2/5/2010 0 9,400 18,800 310,012
Bergren 2/5/2010 0 552,500 1,657,500
2/5/2010 81,756 32.98 659,090
2/5/2010 0 5,458 10,916 180,005
(1) Amounts in columns (c), (d) and (e) provide the minimum amount, target amount and maximum amounts payable as annual incentive compensation under
the YUM Leaders’ Bonus Program based on the Company’s performance and on each executive’s individual performance during 2010. The actual amount
of annual incentive compensation awarded for 2010 is shown in column (f) of the Summary Compensation Table on page 52. The performance
measurements, performance targets, and target bonus percentages are described in the Compensation Discussion and Analysis beginning on page 39 under
the discussion of annual incentive compensation.