Pizza Hut 2010 Annual Report Download - page 143
Download and view the complete annual report
Please find page 143 of the 2010 Pizza Hut annual report below. You can navigate through the pages in the report by either clicking on the pages listed below, or by using the keyword search tool below to find specific information within the annual report.-
 1
1 -
2
-
3
-
4
-
5
-
6
-
7
-
8
-
9
-
10
-
11
-
12
-
13
-
14
-
15
-
16
-
17
-
18
-
19
-
20
-
21
-
22
-
23
-
24
-
25
-
26
-
27
-
28
-
29
-
30
-
31
-
32
-
33
-
34
-
35
-
36
-
37
-
38
-
39
-
40
-
41
-
42
-
43
-
44
-
45
-
46
-
47
-
48
-
49
-
50
-
51
-
52
-
53
-
54
-
55
-
56
-
57
-
58
-
59
-
60
-
61
-
62
-
63
-
64
-
65
-
66
-
67
-
68
-
69
-
70
-
71
-
72
-
73
-
74
-
75
-
76
-
77
-
78
-
79
-
80
-
81
-
82
-
83
-
84
-
85
-
86
-
87
-
88
-
89
-
90
-
91
-
92
-
93
-
94
-
95
-
96
-
97
-
98
-
99
-
100
-
101
-
102
-
103
-
104
-
105
-
106
-
107
-
108
-
109
-
110
-
111
-
112
-
113
-
114
-
115
-
116
-
117
-
118
-
119
-
120
-
121
-
122
-
123
-
124
-
125
-
126
-
127
-
128
-
129
-
130
-
131
-
132
-
 133
133 -
 134
134 -
 135
135 -
 136
136 -
 137
137 -
 138
138 -
 139
139 -
 140
140 -
 141
141 -
 142
142 -
 143
143 -
 144
144 -
 145
145 -
 146
146 -
 147
147 -
 148
148 -
 149
149 -
 150
150 -
 151
151 -
 152
152 -
 153
153 -
154
-
155
-
156
-
157
-
158
-
159
-
160
-
161
-
162
-
163
-
164
-
165
-
166
-
167
-
168
-
169
-
170
-
171
-
172
-
173
-
174
-
175
-
176
-
177
-
178
-
179
-
180
-
181
-
182
-
183
-
184
-
185
-
186
-
187
-
188
-
189
-
190
-
191
-
192
-
193
-
194
-
195
-
196
-
197
-
198
-
199
-
200
-
201
-
202
-
203
-
204
-
205
-
206
-
207
-
208
-
209
-
210
-
211
-
212
-
213
-
214
-
215
-
216
-
217
-
218
-
219
-
220
-
221
-
222
-
223
-
224
-
225
-
226
-
227
-
228
-
229
-
230
-
231
-
232
-
233
-
234
-
235
-
236
 |
 |

46
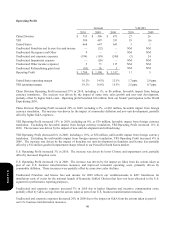
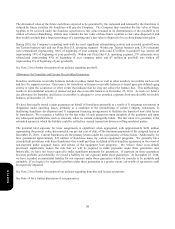
Operating Profit
Amount % B/(W)
2010 2009 2008 2010 2009
China Division
$
755 $ 596 $ 471 27 26
YRI 589 497 531 19 (6
)
United States 668 647 641 3 1
Unallocated Franchise and license fees and income
—
(32)
—
NM NM
Unallocated Occupancy and Other 9
—
—
NM NM
Unallocated and corporate expenses (194) (189) (248) (3
)
24
Unallocated Impairment expense
—
(26)
—
NM NM
Unallocated Other income (expense) 5 71 117 NM NM
Unallocated Refranchising gain (loss) (63
)
26 5 NM NM
Operating Profit
$
1,769 $ 1,590 $ 1,517 11 5
United States operating margin 16.2
%
14.5
%
12.5% 1.7 ppts. 2.0 ppts.
YRI operating margin 19.1
%
16.6
%
15.9% 2.5 ppts. 0.7 ppts.
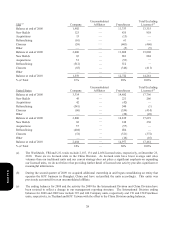
China Division Operating Profit increased 27% in 2010, including a 1%, or $6 million, favorable impact from foreign
currency translation. The increase was driven by the impact of same store sales growth and new unit development,
partially offset by higher G&A costs. Operating profit benefited $16 million from our brands’ participation in the World
Expo during 2010.
China Division Operating Profit increased 26% in 2009, including a 2%, or $10 million, favorable impact from foreign
currency translation. The increase was driven by the impact of commodity deflation and new unit development, partially
offset by higher G&A expenses.
YRI Operating Profit increased 19% in 2010, including an 8%, or $36 million, favorable impact from foreign currency
translation. Excluding the favorable impact from foreign currency translation, YRI Operating Profit increased 11% in
2010. The increase was driven by the impact of new unit development and refranchising.
YRI Operating Profit decreased 6% in 2009, including a 10%, or $56 million, unfavorable impact from foreign currency
translation. Excluding the unfavorable impact from foreign currency translation, YRI Operating Profit increased 4% in
2009. The increase was driven by the impact of franchise net unit development on franchise and license fees partially
offset by a $12 million goodwill impairment charge related to our Pizza Hut South Korea market.
U.S. Operating Profit increased 3% in 2010. The increase was driven by lower Closure and impairment costs, partially
offset by increased litigation costs.
U.S. Operating Profit increased 1% in 2009. The increase was driven by the impact on G&A from the actions taken as
part of our U.S. business transformation measures and improved restaurant operating costs, primarily driven by
commodity deflation. These increases were partially offset by same store sales declines.
Unallocated Franchise and license fees and income for 2009 reflects our reimbursements to KFC franchisees for
installation costs of ovens for the national launch of Kentucky Grilled Chicken that have not been allocated to the U.S.
segment for performance reporting purposes.
Unallocated and corporate expenses increased 3% in 2010 due to higher litigation and incentive compensation costs,
partially offset by G&A savings from the actions taken as part of our U.S. business transformation measures.
Unallocated and corporate expenses decreased 24% in 2009 due to the impact on G&A from the actions taken as part of
our U.S. business transformation measures.
Form 10-K