Pizza Hut 2010 Annual Report Download - page 174
Download and view the complete annual report
Please find page 174 of the 2010 Pizza Hut annual report below. You can navigate through the pages in the report by either clicking on the pages listed below, or by using the keyword search tool below to find specific information within the annual report.
77
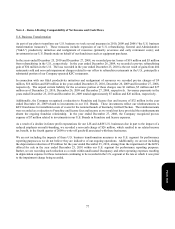
Note 4 – Items Affecting Comparability of Net Income and Cash Flows
U.S. Business Transformation
As part of our plan to transform our U.S. business we took several measures in 2010, 2009 and 2008 (“the U.S. business
transformation measures”). These measures include: expansion of our U.S. refranchising; General and Administrative
(“G&A”) productivity initiatives and realignment of resources (primarily severance and early retirement costs); and
investments in our U.S. Brands made on behalf of our franchisees such as equipment purchases.
In the years ended December 25, 2010 and December 27, 2008, we recorded pre-tax losses of $18 million and $5 million
from refranchising in the U.S., respectively. In the year ended December 26, 2009, we recorded a pre-tax refranchising
gain of $34 million in the U.S. The loss recorded in the year ended December 25, 2010 is the net result of gains from 404
restaurants sold and non-cash impairment charges related to our offers to refranchise restaurants in the U.S., principally a
substantial portion of our Company operated KFC restaurants.
In connection with our G&A productivity initiatives and realignment of resources we recorded pre-tax charges of $9
million, $16 million and $49 million in the years ended December 25, 2010, December 26, 2009 and December 27, 2008,
respectively. The unpaid current liability for the severance portion of these charges was $1 million, $5 million and $27
million as of December 25, 2010, December 26, 2009 and December 27, 2008, respectively. Severance payments in the
years ended December 25, 2010 and December 26, 2009 totaled approximately $7 million and $26 million, respectively.
Additionally, the Company recognized a reduction to Franchise and license fees and income of $32 million in the year
ended December 26, 2009 related to investments in our U.S. Brands. These investments reflect our reimbursements to
KFC franchisees for installation costs of ovens for the national launch of Kentucky Grilled Chicken. The reimbursements
were recorded as a reduction to Franchise and license fees and income as we would not have provided the reimbursements
absent the ongoing franchise relationship. In the year ended December 27, 2008, the Company recognized pre-tax
expense of $7 million related to investments in our U.S. Brands in Franchise and license expenses.
As a result of a decline in future profit expectations for our LJS and A&W-U.S. businesses due in part to the impact of a
reduced emphasis on multi-branding, we recorded a non-cash charge of $26 million, which resulted in no related income
tax benefit, in the fourth quarter of 2009 to write-off goodwill associated with these businesses.
We are not including the impacts of these U.S. business transformation measures in our U.S. segment for performance
reporting purposes as we do not believe they are indicative of our ongoing operations. Additionally, we are not including
the depreciation reduction of $9 million for the year ended December 25, 2010, arising from the impairment of the KFCs
offered for sale in the year ended December 25, 2010 within our U.S. segment for performance reporting purposes.
Rather, we are recording such reduction as a credit within unallocated Occupancy and other operating expenses resulting
in depreciation expense for these restaurants continuing to be recorded in the U.S. segment at the rate at which it was prior
to the impairment charge being recorded.
Form 10-K


